Introduction
Observable infrastructure needs systematic metric collection, alerting, and visualization. Prometheus emerged as the monitoring standard for cloud-native environments, providing flexible metric collection, powerful querying, and integration with visualization platforms. This guide covers complete Prometheus deployment and configuration for production monitoring.
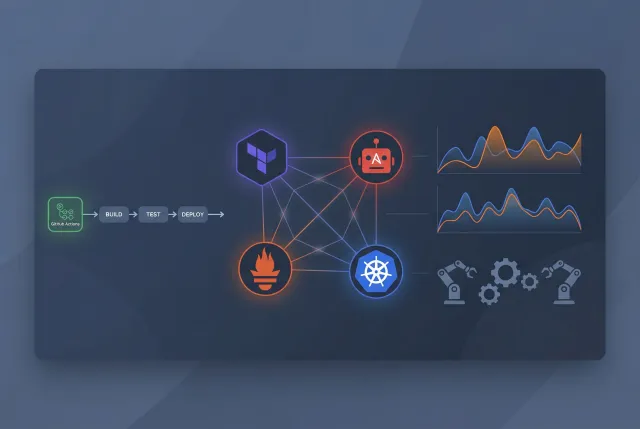
Prometheus operates on a pull-based model, periodically scraping metrics from configured targets. This design simplifies configuration compared to push-based systems while enabling dynamic service discovery in containerized environments. Knowledge of Prometheus architecture guides effective deployment and troubleshooting.
Monitoring serves multiple purposes: incident detection, capacity planning, and performance optimization. Good monitoring strategies balance alert sensitivity against noise, ensuring notifications arrive for actionable issues while filtering expected variations.
Prometheus Architecture Fundamentals
Prometheus components collect, store, and expose metrics for analysis. Learn how these components interact to guide your deployment architecture.
Core Components
The Prometheus server handles metric collection, storage, and querying:
# Run Prometheus container
docker run -d \
  --name prometheus \
  -p 9090:9090 \
  -v $(pwd)/prometheus.yml:/etc/prometheus/prometheus.yml:ro \
  -v prometheus-data:/prometheus \
  prom/prometheus:latest

# Verify Prometheus is running
curl http://localhost:9090/api/v1/status/config
Prometheus stores time series data locally with configurable retention. The query language (PromQL) enables flexible metric analysis and alerting rule definition.
Service Discovery
Dynamic environments require automatic target detection rather than static configuration:
# prometheus.yml with Docker service discovery
global:
  scrape_interval: 15s
  evaluation_interval: 15s

scrape_configs:
  - job_name: 'prometheus'
    static_configs:
      - targets: ['localhost:9090']

  - job_name: 'docker'
    docker_sd_configs:
      - host: unix:///var/run/docker.sock
        refresh_interval: 5s
Service discovery labels enable flexible metric filtering and relabeling. The relabel_configs section transforms discovered labels into useful identifiers for monitoring and alerting.
Exporters and Metrics Sources
Exporters expose metrics in Prometheus format for systems that do not natively support Prometheus:
# Node Exporter for system metrics
docker run -d \
  --name node-exporter \
  --network monitor \
  -v /proc:/host/proc:ro \
  -v /sys:/host/sys:ro \
  -v /:/rootfs:ro \
  prom/node-exporter:latest \
  --path.procfs=/host/proc \
  --path.sysfs=/host/sys \
  --path.rootfs=/rootfs

# Redis Exporter
docker run -d \
  --name redis-exporter \
  --network monitor \
  oliver006/redis_exporter:latest \
  --redis.addr=redis://redis-server:6379
Each exporter provides metrics relevant to specific systems. Node Exporter provides system-level metrics including CPU, memory, disk, and network.
Building Complete Monitoring Stack
Deploy comprehensive monitoring with Prometheus, exporters, and visualization tools.
Docker Compose Monitoring Stack
Define complete monitoring infrastructure with Docker Compose:
# docker-compose.monitor.yml
version: '3.8'

services:
  prometheus:
    image: prom/prometheus:latest
    container_name: prometheus
    ports:
      - "9090:9090"
    volumes:
      - ./prometheus.yml:/etc/prometheus/prometheus.yml:ro
      - ./alert.rules:/etc/prometheus/alert.rules:ro
      - prometheus-data:/prometheus
    command:
      - '--config.file=/etc/prometheus/prometheus.yml'
      - '--storage.tsdb.path=/prometheus'
      - '--storage.tsdb.retention.time=15d'
    networks:
      - monitor

  node-exporter:
    image: prom/node-exporter:latest
    container_name: node-exporter
    ports:
      - "9100:9100"
    volumes:
      - /proc:/host/proc:ro
      - /sys:/host/sys:ro
      - /:/rootfs:ro
    networks:
      - monitor

  alertmanager:
    image: prom/alertmanager:latest
    container_name: alertmanager
    ports:
      - "9093:9093"
    volumes:
      - ./alertmanager.yml:/etc/alertmanager/alertmanager.yml:ro
    networks:
      - monitor

  grafana:
    image: grafana/grafana:latest
    container_name: grafana
    ports:
      - "3000:3000"
    environment:
      - GF_SECURITY_ADMIN_PASSWORD=admin
    networks:
      - monitor

networks:
  monitor:
    driver: bridge

volumes:
  prometheus-data:
The complete stack provides metric collection, storage, alerting, and visualization. Each component handles specific monitoring functions while integration enables unified infrastructure visibility.
Alerting Configuration
Define alerting rules that trigger notifications when metrics indicate problems:
# alert.rules
groups:
  - name: node.rules
    rules:
      - alert: HighCPUUsage
        expr: 100 - (avg by(instance) (rate(node_cpu_seconds_total{mode="idle"}[5m])) * 100) > 80
        for: 5m
        labels:
          severity: warning
        annotations:
          summary: "High CPU usage on {{ $labels.instance }}"
          description: "CPU usage is above 80% for 5 minutes"

      - alert: HighMemoryUsage
        expr: (1 - (node_memory_MemAvailable_bytes / node_memory_MemTotal_bytes)) * 100 > 85
        for: 5m
        labels:
          severity: warning
        annotations:
          summary: "High memory usage on {{ $labels.instance }}"
          description: "Memory usage is above 85%"

      - alert: DiskSpaceLow
        expr: (1 - (node_filesystem_avail_bytes{mountpoint="/"} / node_filesystem_size_bytes{mountpoint="/"})) * 100 > 85
        for: 10m
        labels:
          severity: warning
        annotations:
          summary: "Disk space low on {{ $labels.instance }}"
Alert configurations specify expressions, duration thresholds, and notification labels. Appropriate label assignment routes alerts to correct teams and communication channels.
Alertmanager Configuration
Configure Alertmanager to route notifications to appropriate destinations:
# alertmanager.yml
global:
  resolve_timeout: 5m

route:
  group_by: ['alertname', 'severity']
  group_wait: 30s
  group_interval: 5m
  repeat_interval: 4h
  receiver: 'default'
  routes:
    - match:
        severity: critical
      receiver: 'pagerduty'
    - match:
        severity: warning
      receiver: 'slack'

receivers:
  - name: 'default'
    webhook_configs:
      - url: 'http://webhook-server:5000/alerts'

  - name: 'pagerduty'
    pagerduty_configs:
      - service_key: '<PAGERDUTY_SERVICE_KEY>'
        severity: critical

  - name: 'slack'
    slack_configs:
      - channel: '#alerts'
        send_resolved: true
        api_url: '<SLACK_WEBHOOK_URL>'
Alert routing determines which receivers handle specific alerts. Grouping combines related alerts to reduce notification volume.
PromQL Query Language
PromQL enables flexible metric querying for dashboards, alerting, and analysis.
Basic Queries
Simple queries retrieve time series data for visualization:
# All CPU metrics from all instances
node_cpu_seconds_total

# CPU idle percentage by instance
100 - avg by (instance) (rate(node_cpu_seconds_total{mode="idle"}[5m])) * 100

# Memory available bytes
node_memory_MemAvailable_bytes

# Memory utilization percentage
(1 - (node_memory_MemAvailable_bytes / node_memory_MemTotal_bytes)) * 100

# Network traffic in bytes per second
rate(node_network_receive_bytes_total[5m])
Rate functions calculate per-second rates for counter metrics, converting accumulated values into meaningful rates.
Aggregation and Time Functions
Aggregate metrics across dimensions:
# Sum CPU usage across all modes
sum(rate(node_cpu_seconds_total[5m])) by (mode)

# Top 10 instances by memory usage
topk(10, (1 - (node_memory_MemAvailable_bytes / node_memory_MemTotal_bytes)) * 100)

# Values from 1 hour ago
node_memory_MemAvailable_bytes offset 1h

# Moving average over 1 hour
avg_over_time(node_memory_MemAvailable_bytes[1h])
Time functions enable trend analysis, forecasting, and historical comparison useful for capacity planning.
Grafana Integration
Grafana transforms Prometheus metrics into actionable dashboards.
Data Source Configuration
Configure Grafana to consume Prometheus data through provisioning:
# Grafana provisioning datasource
apiVersion: 1

datasources:
  - name: Prometheus
    type: prometheus
    access: proxy
    url: http://prometheus:9090
    isDefault: true
Dashboard Creation
Create comprehensive dashboards for infrastructure visibility. Panels display CPU, memory, network, and disk metrics with appropriate visualization types and thresholds.
Conclusion
Prometheus provides flexible, scalable monitoring for modern infrastructure. The pull-based model, powerful query language, and extensive ecosystem of exporters make it suitable for diverse monitoring requirements.
Effective monitoring combines appropriate alert thresholds, thoughtful dashboard design, and reliable notification routing. Start with basic metrics and alerts, expanding coverage as application requirements evolve.
Related Posts: