Introduction
Every Linux administrator encounters problems that require systematic investigation. Whether services fail to start, systems become unresponsive, or performance degrades, knowing how to diagnose issues quickly minimizes downtime and reduces stress during incidents.
This guide presents a systematic approach to Linux troubleshooting. Rather than memorizing commands, you will learn to identify which tools address which problem types. The methodology works regardless of the specific issue, providing a framework you can apply to novel problems.
The examples use common Linux utilities available on Ubuntu, RHEL, and other mainstream distributions. Each command includes explanation of what it reveals and when to use it. By the end, you will have a mental toolkit for approaching any Linux problem.
Systematic Troubleshooting Approach
Troubleshooting follows a methodology rather than random experimentation. This structured approach finds root causes faster and prevents symptom treatment while underlying problems persist.
The Investigation Process
When encountering a problem, begin by gathering information without making changes. Identify what changed recently, when the problem began, and which systems are affected. Review logs, check recent configuration changes, and examine system state.
After gathering information, form hypotheses about potential causes. Test each hypothesis systematically, documenting results. When a hypothesis proves correct, verify that addressing it resolves the problem. Document the issue and solution for future reference.
Common Problem Categories
Most Linux issues fall into predictable categories. Service problems involve applications failing to start or crashing. Performance issues show as slow responses or high resource usage. Network problems prevent communication between systems. Storage problems manifest as full disks or I/O bottlenecks. Authentication problems prevent legitimate access.
Identifying the category quickly points you toward relevant diagnostic tools. A service crash produces different logs than a network outage. Understanding problem types saves time during incident response.
Process and Resource Monitoring
Understanding what processes run and how they use resources reveals many problems. These commands provide visibility into system activity.
Process Analysis
The ps command shows running processes with various levels of detail:
# Show all processes with full command lines
ps auxf

# Show processes in tree format (parent-child relationships)
ps axjf

# Find specific processes
ps aux | grep nginx

# Show processes by user
ps -U www-data -o pid,user,command

# Find processes using specific ports
ps aux | grep ':80' | grep -v grep
The pkill and pkill commands locate and manage processes:
# Find process ID
pgrep -f nginx

# Find process with details
pidof nginx

# Kill all processes matching pattern
pkill -9 nginx

# Kill processes by user
pkill -9 -u www-data
For real-time process monitoring, htop provides an interactive interface:
# Install and run htop
sudo apt install htop -y
htop
htop displays CPU, memory, and swap usage with color-coded bars. You can sort by any column, search for processes, and send signals directly from the interface.
Resource Usage Analysis
Monitor resource usage to identify bottlenecks and capacity issues:
# CPU and memory usage
top

# Memory usage by process
ps aux --sort=-%mem | head -20

# Memory and swap usage
free -h

# I/O usage by process
sudo iotop

# Network usage by process
sudo nethogs eth0

# Disk usage by directory
du -sh /var/* | sort -h

# Find largest files
find /var -type f -size +100M -exec ls -lh {} \;
Resource analysis identifies whether problems stem from CPU exhaustion, memory pressure, disk I/O bottlenecks, or network saturation. Each cause requires different remediation.
System Load Analysis
System load indicates overall demand on system resources:
# View load average
uptime

# Detailed load analysis
cat /proc/loadavg

# View load with additional info
w

# Correlate load with processes
top -bn1 | head -20
Load averages show demand over 1, 5, and 15 minutes. A load of 4 on a 4-core system indicates full utilization. Load consistently above capacity suggests capacity planning needs.
Network Diagnostics
Network problems require tools that reveal connectivity, routing, and service availability.
Connectivity Testing
Basic connectivity tests confirm network paths work:
# Test reachability
ping -c 4 google.com

# Check DNS resolution
nslookup example.com
dig example.com +short

# Trace network path
traceroute google.com

# Check port accessibility
nc -zv example.com 80
nc -zv example.com 443

# Test specific service
curl -I http://example.com
curl -u user:password http://example.com
Network troubleshooting follows the OSI model from physical layer upward. Start with basic connectivity, then progress through routing, DNS, and application-layer tests.
Service Discovery
Identify which services listen on which ports:
# List listening ports
ss -tlnp
ss -tlnp | grep 443

# Show established connections
ss -tnp
ss -tnp | grep ESTAB

# View network statistics
netstat -s

# Show firewall rules
sudo iptables -L -n -v
sudo nft list ruleset
Understanding which ports are open and which connections are active reveals misconfigurations and unexpected services.
Advanced Diagnostics
For complex network issues, capture and analyze traffic:
# Capture packets (basic)
sudo tcpdump -i eth0 host 10.0.0.1

# Capture specific port traffic
sudo tcpdump -i eth0 port 80

# Capture and save to file
sudo tcpdump -i eth0 -w capture.pcap

# Analyze captured file
tcpdump -r capture.pcap

# Display HTTP traffic
sudo tcpdump -i eth0 -A 'port 80' | grep GET
Packet capture reveals protocol-level details that other tools cannot provide. Use it when other diagnostics fail to explain the problem.
Log Analysis
Linux systems generate extensive logs that document system activity. Learning to read and filter logs quickly reveals problem causes.
System Log Locations
Common log directories and files include:
# Application logs
/var/log/nginx/access.log
/var/log/nginx/error.log
/var/log/apache2/error.log
/var/log/postgresql/postgresql.log
/var/log/mysql/error.log

# System logs
/var/log/syslog
/var/log/messages
/var/log/auth.log
/var/log/dmesg
/var/log/kern.log

# Journal logs (systemd systems)
journalctl -u nginx.service
journalctl -f
journalctl --since "1 hour ago"
Know which logs contain relevant information for your investigation. Application-specific logs often provide the most useful information.
Log Filtering
Filter logs to find relevant entries quickly:
# Search for errors
grep -i error /var/log/syslog

# View recent errors
tail -100 /var/log/syslog | grep -i error

# Search across multiple logs
grep -r "connection failed" /var/log/

# Use journalctl for systemd services
journalctl -u nginx --since today --grep "error"

# Follow logs in real-time
tail -f /var/log/nginx/access.log

# Count occurrences
grep "404" /var/log/nginx/access.log | wc -l
Complex filters combine multiple conditions:
# Find errors from specific IP
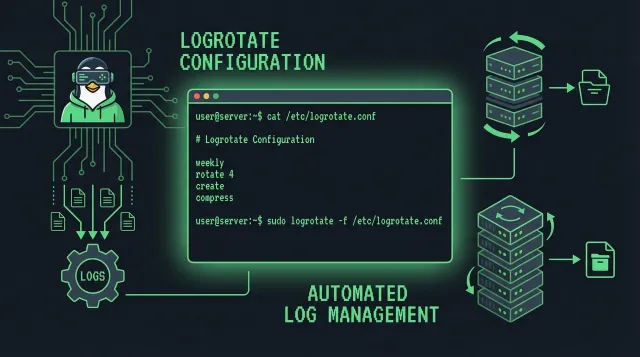
journalctl --since "2024-01-15" | grep "ERROR" | grep "192.168.1.100"Log Rotation and Management
Prevent logs from consuming all disk space:
# View log rotation configuration
cat /etc/logrotate.conf

# View specific log rotation rules
cat /etc/logrotate.d/nginx

# Force log rotation
sudo logrotate -f /etc/logrotate.conf

# Check for open log files
lsof | grep log
Understanding log rotation prevents confusion when files appear to disappear or new files appear.
Disk and Storage Issues
Disk problems manifest as failed writes, slow performance, or full filesystems.
Filesystem Usage
Monitor disk usage to prevent exhaustion:
# Overall disk usage
df -h

# Usage by filesystem type
df -h -T

# Directory sizes
du -sh /var/*
du -sh /var/log/* | sort -h

# Find large files
find / -type f -size +500M -exec ls -lh {} \;

# Inode usage (can fill even with available space)
df -i
Filesystems can run out of inodes even when space remains available. Check both metrics when troubleshooting storage issues.
I/O Performance
Diagnose slow disk performance:
# I/O statistics
iostat -x 1

# Per-process I/O usage
sudo iotop -o

# Check for I/O waits in top
top

# Mount options analysis
mount | grep ' / '
High I/O wait times indicate storage bottlenecks. Consider upgrading storage or optimizing I/O patterns.
Filesystem Checking
Check and repair filesystems safely:
# Check filesystem (unmount first for ext4)
sudo umount /dev/sda1
sudo fsck /dev/sda1

# Check without unmount (limited)
sudo fsck -n /dev/sda1

# View filesystem errors in logs
dmesg | grep -i ext4
Always ensure filesystems are unmounted before running full checks. Use read-only mode when possible to prevent data loss.
Memory Diagnostics
Memory issues cause crashes, slow performance, and unexpected behavior.
Memory Analysis
Understand how memory is used:
# Memory and swap usage
free -h

# Detailed memory information
cat /proc/meminfo

# Memory usage by process
ps aux --sort=-%mem | head

# Shared memory usage
ipcs -m

# Slab cache information
cat /proc/slabinfo
Linux uses available memory for caching, which improves performance. Values shown as “available” indicate memory usable by applications.
Memory Testing
Test for hardware memory issues:
# View memory errors (requires ECC or error logging)
dmesg | grep -i "memory error"

# Check for memory pressure
cat /proc/pressure/memory

# Monitor memory over time
watch -n 1 'free -h'
Memory hardware failures cause intermittent problems that are difficult to diagnose. If you suspect hardware issues, run dedicated memory testing tools.
Swap Configuration
Configure swap appropriately for your workload:
# View current swap
swapon --show

# Check swap usage
cat /proc/swaps

# Adjust swappiness
sysctl vm.swappiness=10

# Create additional swap file
sudo dd if=/dev/zero of=/swapfile bs=1G count=2
sudo chmod 600 /swapfile
sudo mkswap /swapfile
sudo swapon /swapfile
Insufficient swap causes out-of-memory conditions even when some memory remains. Configure adequate swap for your workload requirements.
Service Debugging
When services fail, systematic debugging identifies the cause.
Service Status Commands
Check service health and state:
# View service status
systemctl status nginx

# View recent logs
journalctl -u nginx -n 50

# Follow logs in real-time
journalctl -u nginx -f

# Check service configuration
systemctl cat nginx

# View dependencies
systemctl list-dependencies nginx
Service status shows whether systemd considers the service active and recent log entries. Failed services show exit codes and error messages.
Service Debugging Steps
When services fail, follow this sequence:
# 1. Check status and logs
systemctl status myservice
journalctl -u myservice -n 100

# 2. Test manual execution
cd /opt/myapp
sudo -u myappuser ./bin/start

# 3. Check configuration validity
nginx -t
apachectl configtest

# 4. Verify ports are available
ss -tlnp | grep ':8080'

# 5. Check file permissions
ls -la /opt/myapp/
ls -la /var/log/myapp/

# 6. Review recent changes
journalctl --since "1 hour ago" | grep myapp
Manual execution often reveals configuration or environment problems that systemd conceals. Compare the manual execution environment to the systemd environment.
Performance Profiling
For persistent performance issues, detailed profiling identifies bottlenecks.
CPU Profiling
Identify where CPU time is spent:
# Top CPU consumers
top

# Process hierarchy with CPU
ps auxf --sort=-%cpu | head

# Per-CPU usage
mpstat -P ALL 1

# System-wide CPU statistics
sar -u 1
High user CPU indicates application processing needs optimization. High system CPU suggests kernel or I/O overhead.
I/O Profiling
Profile storage I/O patterns:
# I/O statistics by process
sudo iotop -o -P

# Block device statistics
iostat -x 1

# I/O wait analysis
sar -d 1

# Read/write system calls
strace -c -p $(pgrep -f myapp)
High await times on specific devices indicate storage bottlenecks. Consider upgrading storage or optimizing access patterns.
Conclusion
Effective Linux troubleshooting requires familiarity with diagnostic tools and a systematic approach. The techniques in this guide address common problem categories and provide frameworks for novel issues.
Build your troubleshooting skills by practicing with these commands in development environments. Create test scenarios that simulate common failures. The more familiar you are with diagnostic tools, the faster you can respond during production incidents.
Document troubleshooting steps and solutions for recurring issues. This documentation accelerates future incident response and helps team members develop troubleshooting skills.
Related Posts: