Introduction
Server logs contain diagnostic information essential for troubleshooting, security analysis, and performance optimization. Raw log data overwhelms manual review while proper analysis transforms logs into actionable insights. This guide covers log analysis techniques that accelerate problem resolution and enhance operational visibility.
Log analysis combines command-line tools, pattern recognition, and systematic approaches. Understanding log formats, common patterns, and filtering techniques enables rapid identification of issues. Automated analysis and alerting reduce response times for critical events.
Modern logging architectures centralize log collection while retaining command-line analysis skills for ad-hoc troubleshooting. These foundational skills transfer across different logging systems and platforms.
Log File Locations and Formats
Linux systems generate logs across multiple locations with varying formats. Understanding log organization guides efficient analysis.
System Log Locations
# Core system logs
/var/log/syslog          # Debian/Ubuntu general messages
/var/log/messages         # RHEL/CentOS general messages
/var/log/auth.log         # Authentication events
/var/log/kern.log         # Kernel messages
/var/log/dmesg            # Boot and hardware messages
/var/log/boot.log         # Boot process messages

# Application logs
/var/log/nginx/access.log
/var/log/nginx/error.log
/var/log/apache2/access.log
/var/log/apache2/error.log
/var/log/postgresql/log/
/var/log/mysql/error.log
/var/log/docker/containers/

# Security logs
/var/log/ufw.log          # Firewall logs
/var/log/fail2ban.log     # Fail2ban events
/var/log/audit/audit.log  # Linux audit subsystem
Log rotation prevents disk exhaustion while retaining historical data. Configure rotation policies based on storage availability and retention requirements.
Log Format Types
Logs use various formats requiring different parsing approaches:
# Syslog format (timestamp, hostname, process, message)
# Feb  8 14:15:32 server kernel: [    0.000000] Initializing cgroup subsys cpuset

# Apache/Nginx combined log format
# 192.168.1.100 - - [08/Feb/2026:14:15:32 +0000] "GET /index.html HTTP/1.1" 200 1024 "-" "Mozilla/5.0"

# JSON log format
# {"level":"error","timestamp":"2026-02-08T14:15:32Z","message":"Connection failed","error":"ETIMEDOUT"}

# Docker JSON logs
# {"log":"Application started\n","stream":"stdout","time":"2026-02-08T14:15:32.123456789Z"}
JSON logs parse easily with jq. Syslog and Apache formats require field extraction using awk or parsing expressions.
Essential Log Analysis Commands
Mastering fundamental commands enables rapid log exploration.
grep and Regular Expressions
# Basic pattern matching
grep "error" /var/log/syslog
grep -i "failed" /var/log/auth.log

# Context lines (before and after)
grep -B 3 -A 3 "authentication failure" /var/log/auth.log
grep -C 5 "connection refused" /var/log/syslog

# Count occurrences
grep -c "error" /var/log/syslog
grep -ci "error\|warn" /var/log/syslog

# Invert match (exclude patterns)
grep -v "INFO" /var/log/app.log

# Extended regex for complex patterns
grep -E "error|fatal|critical" /var/log/syslog
grep -E "[0-9]{1,3}\.[0-9]{1,3}\.[0-9]{1,3}\.[0-9]{1,3}" /var/log/nginx/access.log

# Perl-compatible regex
grep -P "error:\s+\K\d+" /var/log/app.log
Regular expressions enable precise pattern matching across log formats. -P provides Perl-compatible regex with powerful features like lookbehind.
awk for Field Extraction
# Basic field printing
awk '{print $1}' /var/log/nginx/access.log

# Specific fields from Apache log
awk '{print $1, $7, $9}' /var/log/nginx/access.log

# Field delimiter specification
awk -F: '{print $1}' /etc/passwd
awk -F'"' '{print $2}' /var/log/app.json

# Conditional filtering
awk '$9 > 400 {print $1, $7, $9}' /var/log/nginx/access.log
awk '$7 ~ /\/api\// {print $1, $7}' /var/log/nginx/access.log

# Aggregate statistics
awk '{print $7}' /var/log/nginx/access.log | sort | uniq -c | sort -rn

# Pattern matching with awk
/POST/ && /500/ {count++}
END {print "POST 500 errors:", count}
awk processes log fields for statistics and filtering. Combine with other commands for complex analysis.
sed for Stream Editing
# Find and replace
sed 's/error/WARN/g' /var/log/app.log

# In-place editing
sed -i 's/192.168.1.1/10.0.0.1/g' /var/log/app.log

# Delete lines matching pattern
sed '/^#/d' /etc/nginx/nginx.conf

# Extract specific lines
sed -n '1,100p' /var/log/app.log

# Multiple commands
sed -e '/^$/d' -e 's/old/new/g' /var/log/app.log
sed enables line-level transformations and extractions. In-place editing requires caution with production logs.
journalctl for Systemd Logs
# View all journal logs
journalctl

# Follow logs in real-time
journalctl -f

# Filter by time
journalctl --since "2026-02-08 00:00:00"
journalctl --since "1 hour ago"
journalctl --until "2026-02-07 12:00:00"

# Filter by unit
journalctl -u nginx
journalctl -u docker.service

# Priority filtering
journalctl -p err..emerg
journalctl -p warning

# Reverse order (newest first)
journalctl -r

# JSON output for parsing
journalctl -o json
journalctl -o json-pretty

# Persistent journal storage
mkdir -p /var/log/journal
systemd-tmpfiles --create --prefix /var/log/journal
journalctl replaces traditional syslog for systemd systems. Advanced filtering enables targeted log review.
Advanced Log Processing
Combine tools for complex analysis scenarios.
Pipeline Patterns
# Find most common errors
grep "ERROR" /var/log/app.log | \
  awk -F'[:]' '{print $NF}' | \
  sort | uniq -c | sort -rn | head -20

# Identify slow requests
awk '$NF > 5 {print $7, $NF}' /var/log/nginx/access.log | \
  sort -rn | head -20

# Extract IP addresses with failed logins
grep "Failed password" /var/log/auth.log | \
  awk '{print $11}' | sort | uniq -c | sort -rn

# Real-time error monitoring
journalctl -u nginx -p err --since "1 hour ago" | \
  grep -v "127.0.0.1" | \
  tail -f
Pipeline patterns chain simple tools for sophisticated analysis. Each command transforms data for the next.
Log Statistics and Aggregation
# Request counts by hour
awk '{print $4}' /var/log/nginx/access.log | \
  cut -d: -f1 | \
  sort | uniq -c

# Bandwidth usage by IP
awk '{sum[$1] += $10} END {for (ip in sum) printf "%s %s\n", ip, sum[ip]}' \
  /var/log/nginx/access.log | sort -rn

# Error rate calculation
total=$(wc -l < /var/log/nginx/access.log)
errors=$(grep -c " 5[0-9][0-9] " /var/log/nginx/access.log)
echo "Error rate: $((errors * 100 / total))%"

# Top 10 404 pages
awk '$9 == 404 {print $7}' /var/log/nginx/access.log | \
  sort | uniq -c | sort -rn | head -10
Log statistics reveal patterns invisible in raw data. Regular statistics inform capacity planning and debugging priorities.
Pattern Detection with Scripts
#!/bin/bash
# analyze-errors.sh - Detect error patterns in application logs

LOG_FILE=${1:-/var/log/app.log}
ERROR_PATTERN=${2:-"ERROR|WARN|FATAL"}

echo "=== Error Analysis for $LOG_FILE ==="
echo ""

echo "Error counts by type:"
grep -oE "$ERROR_PATTERN" "$LOG_FILE" | sort | uniq -c | sort -rn

echo ""
echo "Errors over time (hourly):"
grep -E "$ERROR_PATTERN" "$LOG_FILE" | \
  awk '{print $2}' | \
  cut -d: -f1-2 | \
  sort | uniq -c

echo ""
echo "Most recent errors:"
tail -50 "$LOG_FILE" | grep -E "$ERROR_PATTERN"

echo ""
echo "Unique error messages:"
grep -E "$ERROR_PATTERN" "$LOG_FILE" | \
  sed 's/.*\(ERROR\|WARN\|FATAL\)/\1/' | \
  sort -u
Shell scripts encapsulate complex analysis for repeated use. Version control scripts for future reference.
Log Rotation and Management
Proper log management prevents disk exhaustion while retaining necessary data.
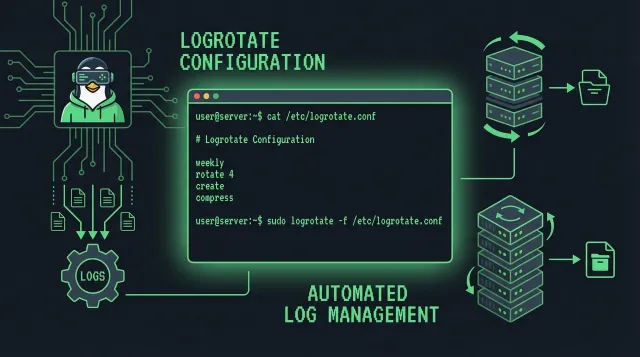
logrotate Configuration
# /etc/logrotate.d/application
/var/log/app/*.log {
    daily
    rotate 30
    compress
    delaycompress
    missingok
    notifempty
    create 0640 www-data www-data
    postrotate
        systemctl reload application > /dev/null 2>&1 || true
    endscript
}

# Nginx log rotation
/var/log/nginx/*.log {
    daily
    rotate 14
    compress
    delaycompress
    missingok
    notifempty
    create 0640 www-data adm
    sharedscripts
    postrotate
        [ -f /var/run/nginx.pid ] && kill -USR1 $(cat /var/run/nginx.pid)
    endscript
}
Log rotation policies balance storage constraints against retention requirements. Compression reduces storage while delaycompress preserves recent logs in original format.
Compressed Log Handling
# Search in compressed logs
zgrep "error" /var/log/app/log-*.gz

# View compressed log
zcat /var/log/app/log-20260208.gz | head -100

# Combine compressed and uncompressed
zcat /var/log/app/log-*.gz | grep "error"

# Statistics from compressed logs
zcat /var/log/nginx/access.log-*.gz | wc -l
zgrep, zcat, and related commands handle compressed files transparently. Greatly extends search capabilities.
Security Log Analysis
Identify security events through systematic log review.
Authentication Analysis
# Failed SSH attempts
grep "Failed password" /var/log/auth.log

# Successful SSH logins
grep "Accepted" /var/log/auth.log

# Root login attempts
grep "ROOT" /var/log/auth.log

# Connections from unusual locations
awk '$9 == 22' /var/log/ufw.log | awk '{print $5}' | sort -u

# Brute force detection
awk '/Failed password/ {ip[$11]++} END {for (i in ip) if (ip[i] > 10) print ip[i], i}' \
  /var/log/auth.log
Authentication logs reveal intrusion attempts and successful compromises. Regular review identifies attack patterns.
Web Server Security Analysis
# SQL injection attempts
grep -E "'|UNION|SELECT|INSERT|UPDATE|DELETE" /var/log/nginx/access.log

# Path traversal attempts
grep -E "\.\./|\.\.%2f" /var/log/nginx/access.log

# Scanner signatures
grep -E "wget|curl|bot|spider" /var/log/nginx/access.log | head -20

# 403 forbidden analysis
awk '$9 == 403 {print $7, $11}' /var/log/nginx/access.log | \
  sort | uniq -c | sort -rn | head -20

# Identify scanning activity
awk '{print $1}' /var/log/nginx/access.log | sort | uniq -c | \
  awk '$1 > 1000 {print}'
Security analysis identifies attack patterns and scanning activity. Elevated baseline request counts may indicate attacks or misconfiguration.
Audit Log Review
# View audit logs
ausearch -m USER_LOGIN -i
ausearch -m SYSCALL -i

# System changes by user
ausearch -ua 1000 -i

# File access monitoring
auditctl -w /etc/passwd -p wa -k identity_check
ausearch -k identity_check

# Command execution
ausearch -m EXECVE -i
Linux audit subsystem provides granular system call monitoring. Rules capture specific events for security analysis.
Creating Log Analysis Dashboards
Transform log data into visual insights.
Command-Line Dashboards
#!/bin/bash
# dashboard.sh - Real-time log monitoring dashboard

while true; do
    clear
    echo "=== Server Log Dashboard ==="
    echo "Time: $(date)"
    echo ""

    echo "=== Nginx Requests (last 5 min) ==="
    awk --time-start="$(date -d '5 minutes ago' '+%d/%b/%Y:%H:%M')" \
        '$4 >= ENVIRON["_time_start"]' /var/log/nginx/access.log | wc -l

    echo ""
    echo "=== Recent Errors ==="
    tail -20 /var/log/nginx/error.log | grep -i error

    echo ""
    echo "=== System Load ==="
    uptime

    echo ""
    echo "=== Memory Usage ==="
    free -h

    echo ""
    echo "=== Disk Usage ==="
    df -h | grep -E "^/dev/|/$"

    sleep 5
done
Shell dashboards provide real-time visibility without complex tooling. Simple scripts suit monitoring needs.
Basic Grafana with Loki
# docker-compose.monitoring.yml
version: '3.8'

services:
  loki:
    image: grafana/loki:latest
    container_name: loki
    ports:
      - "3100:3100"
    volumes:
      - loki-data:/loki
    command: -config.file=/etc/loki/local-config.yaml

  promtail:
    image: grafana/promtail:latest
    container_name: promtail
    volumes:
      - /var/log:/var/log:ro
      - ./promtail.yml:/etc/promtail/promtail.yml:ro
    command: -config.file=/etc/promtail/promtail.yml
    depends_on:
      - loki

  grafana:
    image: grafana/grafana:latest
    container_name: grafana
    ports:
      - "3000:3000"
    environment:
      - GF_SECURITY_ADMIN_PASSWORD=admin
    depends_on:
      - loki

volumes:
  loki-data:
Loki aggregates logs for Grafana visualization. LogQL queries enable sophisticated log analysis through dashboards.
Conclusion
Log analysis transforms raw server data into operational intelligence. Command-line tools provide powerful analysis capabilities without complex infrastructure. Systematic approaches ensure consistent results across different log types and sources.
Automation through scripts and dashboards scales log analysis beyond manual review. Centralized logging with Loki or ELK stack enhances analysis capabilities for distributed systems. Build analysis habits into regular operational routines.
Related Posts: