Every sysadmin has a story about the server that went down because the disk filled up with logs. It’s almost always the same pattern: everything works fine for months, then one morning the monitoring alerts fire, and by the time you look, the disk is at 99% and services are failing. The fix is always the same — you delete some logs and breathe again. The prevention is also straightforward, but most people don’t set it up until after the first outage.
This guide covers the two main systems that manage logs on modern Linux servers: logrotate for text-based log files and systemd-journald for binary journal logs. Both need configuration. Neither works well out of the box for production workloads.
Why logs fill up disks
Applications write logs. Services write logs. The kernel writes logs. On a busy server, the combined output of nginx, PostgreSQL, Docker containers, and systemd services can easily generate several gigabytes of log data per day. Without rotation and cleanup, those logs accumulate until the disk is full.
The problem is worse than it sounds because disk exhaustion doesn’t just affect logging. When a Linux system runs out of disk space, writes fail across the board. Databases can’t write to their data files. Applications can’t create temporary files. Even the logging system itself stops working, which means you lose visibility into what’s happening exactly when you need it most.
The two systems that manage this are logrotate and systemd-journald. They handle different types of logs, use different mechanisms, and require separate configuration. Understanding both is essential.
Configuring logrotate for production
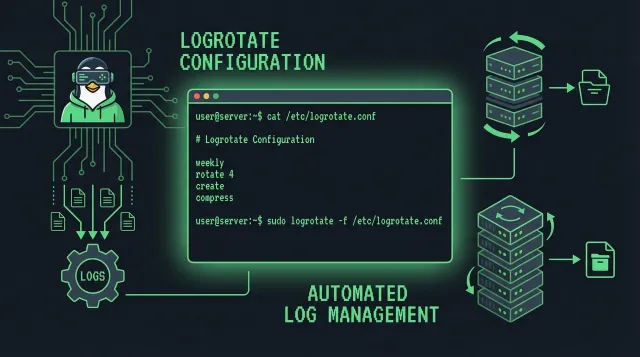
Logrotate is the standard utility for managing text-based log files on Linux. It rotates, compresses, and removes old logs based on size or time policies. The configuration lives in /etc/logrotate.d/, where each file defines rotation rules for specific log paths.
A basic logrotate configuration for a production application looks like this:
/var/log/myapp/*.log {
    daily
    rotate 14
    compress
    delaycompress
    missingok
    notifempty
    copytruncate
    size 100M
}
Here’s what each directive does:
daily runs rotation once per day. You can also use weekly, monthly, or size-based triggers.
rotate 14 keeps 14 rotated files before deleting the oldest. For a daily rotation, this gives you two weeks of history.
compress gzips rotated files to save space. A 100MB log file compresses to roughly 10-15MB.
delaycompress waits one rotation cycle before compressing, so the most recently rotated file stays uncompressed. This matters because some applications keep a file handle open to the log, and compressing it immediately can cause issues.
missingok doesn’t error if the log file doesn’t exist.
notifempty skips rotation if the log file is empty.
copytruncate copies the current log to a rotated file, then truncates the original. This is critical for applications that keep file handles open. Without copytruncate, you need to send the application a signal to reopen its log file after rotation, which most applications don’t handle gracefully.
size 100M triggers rotation when the file exceeds 100MB, even if the daily rotation hasn’t occurred yet. This is a safety net for days when log volume spikes unexpectedly.
Handling application-specific logs
Different applications have different logging behaviors. Here are patterns for common services:
Nginx writes access and error logs to /var/log/nginx/. A production configuration:
/var/log/nginx/access.log {
    daily
    rotate 30
    compress
    delaycompress
    missingok
    notifempty
    sharedscripts
    postrotate
        [ -f /var/run/nginx.pid ] && kill -USR1 $(cat /var/run/nginx.pid)
    endscript
}
The sharedscripts directive runs postrotate scripts once for all matched files instead of once per file. The postrotate script sends USR1 to nginx, telling it to reopen its log files.
Docker containers write logs to /var/lib/docker/containers/<container-id>/<container-id>-json.log. Without rotation, these files grow unbounded. Docker has its own log driver configuration:
{
  "log-driver": "json-file",
  "log-opts": {
    "max-size": "50m",
    "max-file": "3"
  }
}
Set this in /etc/docker/daemon.json for system-wide defaults, or per-container with docker run --log-opt max-size=50m --log-opt max-file=3.
Systemd services write to the journal, which is a separate system covered below. But some services also write to their own log files in /var/log/, and those need logrotate configuration.
Managing systemd journal size
Systemd-journald is the binary logging system that collects logs from the kernel, systemd services, and any application that uses the systemd journal API. Unlike logrotate, which handles text files, journald stores logs in a binary format that’s more efficient to query but requires its own size management.
The journal configuration lives in /etc/systemd/journald.conf. The key settings:
[Journal]
SystemMaxUse=500M
SystemMaxFileSize=100M
MaxRetentionSec=30day
MaxFileSec=1day
Compress=yes
SystemMaxUse limits the total disk space the journal can use. Set this based on your disk size and how much history you need. For most production servers, 200MB to 1GB is reasonable.
SystemMaxFileSize limits the size of individual journal files. The journal rotates files when they reach this size.
MaxRetentionSec deletes journal entries older than this. Set to 30day for two weeks of history, or longer if you need more.
MaxFileSec forces journal rotation at this interval, even if the file hasn’t reached SystemMaxFileSize. This ensures you don’t end up with one massive journal file.
Compress enables compression for older journal files.
After changing journald.conf, restart the journal service:
sudo systemctl restart systemd-journaldTo immediately reclaim space from an oversized journal:
sudo journalctl --vacuum-size=500MThis shrinks the journal to 500MB by deleting the oldest entries. You can also use --vacuum-time=7d to keep only the last week of logs.
The copytruncate trap
One of the most common mistakes in log management is deleting log files that applications still have open. When you run rm /var/log/app.log, the file disappears from the directory, but the data still exists on disk because the process holds an open file descriptor. The disk space isn’t freed until the process closes the descriptor or restarts.
This creates a phantom inode problem: the file is invisible in the directory listing, but it’s still consuming disk space. You can see it with lsof +L1, which lists files with zero hard links — deleted files that are still open.
The fix is to never delete open log files directly. Instead, use one of these approaches:
truncate: truncate -s 0 /var/log/app.log empties the file without deleting it. The application continues writing to the same file, and the space is freed immediately. This is the safest option for most situations.
copytruncate in logrotate: As covered above, this copies the log to a rotated file and truncates the original. The application never notices the change. This is the standard approach for production systems.
restart the application: If you must delete a log file, restart the application afterward so it opens a new file descriptor and the old one is released. This is the least elegant option but sometimes necessary when you’re dealing with a disk-full emergency.
The key insight is that the filesystem and the process have different views of a file. The filesystem sees an inode with a link count. The process sees a file descriptor pointing to that inode. When you delete the file, the link count drops to zero, but the inode persists as long as the process holds the descriptor. Only when the process releases the descriptor does the kernel free the inode and its associated disk blocks.
This is why lsof +L1 is such a useful diagnostic tool. It shows you exactly which deleted files are still consuming space, along with which process is holding them open. In a disk-full emergency, this command tells you which processes to restart to actually reclaim space.
Setting up monitoring
Configuration alone isn’t enough. You need to know when disk usage is trending toward a problem. The simplest approach is a cron job that checks disk usage and sends an alert:
#!/bin/bash
USAGE=$(df / | tail -1 | awk '{print $5}' | sed 's/%//')
if [ "$USAGE" -gt 85 ]; then
    echo "Disk usage at ${USAGE}% on $(hostname)" | mail -s "Disk Alert" admin@example.com
fi
Run this check every 15 minutes via cron, and you’ll get a warning before the disk fills up completely. For more sophisticated monitoring, Prometheus with the node_exporter can track disk usage over time and alert on trends, not just thresholds.
Quick reference
| Task | Command |
|---|---|
| Check current disk usage | df -h / |
| Find largest files | du -sh /var/log/* | sort -rh | head -20 |
| Check open deleted files | lsof +L1 |
| Force logrotate now | sudo logrotate -f /etc/logrotate.d/myapp |
| Shrink journal to 500MB | sudo journalctl --vacuum-size=500M |
| View journal size | journalctl --disk-usage |
| Truncate a log file safely | truncate -s 0 /var/log/app.log |
Putting it together
The combination of logrotate for text logs and journald configuration for binary logs covers most production server scenarios. The key principles to remember:
Configure logrotate for every application that writes to text log files in /var/log. Use copytruncate for applications that keep file handles open. Set size limits and rotation counts that match your retention needs.
Configure journald’s SystemMaxUse and MaxRetentionSec to prevent the journal from growing unbounded. Run journalctl —vacuum-size periodically or set it up as a cron job.
Monitor disk usage proactively. By the time you’re manually deleting logs to free space, you’ve already lost the battle. Set up alerts at 80% usage so you can address the problem before it becomes an outage.
The 3am disk-full emergency is entirely preventable. It just takes 20 minutes of configuration that most people keep putting off until the next outage.
If you’re setting up a new server, make log rotation part of the provisioning process. Add your logrotate configs to your Ansible playbook, your Docker image build script, or your cloud-init user data. If you’re managing existing servers, start with the ones that have the most logging — web servers, databases, and application servers are usually the biggest offenders.
The other thing worth mentioning is that log management isn’t just about disk space. It’s about having the logs you need when you need them. A server with properly configured rotation gives you 14 days of searchable history in logrotate-compressed files and 30 days of queryable history in the journal. A server without rotation gives you whatever fits on disk before the system starts failing.
One more practical tip: test your logrotate configurations before you need them. Run sudo logrotate -d /etc/logrotate.d/myapp to do a dry run that shows what logrotate would do without actually rotating anything. This catches syntax errors and configuration mistakes before they cause problems in production.
And if you’re dealing with a server that’s already out of disk space, the immediate fix is: find the biggest files with du -sh /var/log/* | sort -rh | head -20, truncate the biggest offenders with truncate -s 0, restart any services that were failing, and then set up proper rotation so it doesn’t happen again.