Every process on a Linux server is a running program that consumes CPU, memory, and file descriptors. Managing these processes — finding them, prioritizing them, killing the bad ones, and ensuring the critical ones stay alive — is the core skill of server administration.
This guide covers the full spectrum of Linux process management: from the basics of viewing processes with htop to advanced resource control with cgroups and systemd. Whether you are debugging a runaway process or tuning a production server, these are the tools you need.
What Happens When You Run a Command
When you type a command in a shell, the shell calls fork() to create a copy of itself, then calls exec() to replace that copy with the new program. The original process becomes the parent, and the new process becomes the child. Every process on your system traces back to init (PID 1), which on modern Linux systems is systemd.
Each process has a unique Process ID (PID) and belongs to a user and a group. The kernel tracks process state (running, sleeping, stopped, zombie), memory usage, open file descriptors, and scheduling priority. All of this information is accessible through the /proc filesystem and the tools that read from it.
htop: The Better top
The top command has been the default process viewer on Unix since the 1980s. It works, but it is ugly, hard to navigate, and lacks features that modern servers need. htop replaces it with a color-coded, interactive interface that lets you sort, filter, search, and kill processes without memorizing cryptic key sequences.
Installing htop
Most distributions include htop in their default repositories:
# Ubuntu/Debian
sudo apt install htop

# RHEL/CentOS/Fedora
sudo dnf install htop

# Arch
sudo pacman -S htop
Reading the htop Interface
Run htop and you will see a dashboard divided into sections:
Header bars at the top show CPU usage (one bar per core), memory usage, swap usage, and system load averages. The color coding matters: green is user processes, blue is low-priority processes, red is kernel processes, and magenta is stolen time (relevant for virtual machines).
The process list below shows every running process with columns for PID, user, priority, nice value, virtual memory, resident memory, shared memory, CPU percentage, memory percentage, and command. By default, processes are sorted by CPU usage.
The footer shows function key shortcuts: F1 for help, F2 for setup, F3 to search, F4 to filter, F5 for tree view, F6 to select sort column, F9 to kill, F10 to quit.
Essential htop Operations
Sort by memory: Press F6, select MEM%, and press Enter. This is the most common operation when debugging memory issues.
Tree view: Press F5 to see parent-child relationships. This is invaluable for understanding which process spawned which children. A web server forked 50 workers shows up as a clean tree instead of a flat list.
Search for a process: Press F3, type the process name, and hopt highlights matches. Press F3 again to cycle through results.
Filter by user: Press F4, type the username, and only processes belonging to that user appear.
Kill a process: Navigate to the process, press F9, select a signal (TERM for graceful shutdown, KILL for forced termination), and press Enter.
Change priority: Navigate to a process, press F7 to increase priority (lower nice value) or F8 to decrease priority (higher nice value). This only works if you are root or the process owner.
Customizing htop
Press F2 to enter the setup screen. You can:
- Add or remove columns (PID, USER, PRI, NI, VIRT, RES, SHR, S, CPU%, MEM%, TIME+, Command)
- Change the color scheme
- Customize the header meters
- Set up process filters that persist across sessions
For server monitoring, adding the TGID column (thread group ID) and IO_READ/IO_WRITE columns gives you more visibility into what processes are actually doing.
ps: The Classic Process Snapshot
While htop is great for interactive monitoring, ps is the tool for scripting and one-shot snapshots. It is installed on every Linux system and is the foundation of many monitoring scripts.
Common ps Commands
Show all processes for current user:
ps auxShow processes sorted by memory usage:
ps aux --sort=-%mem | head -20Show process tree:
ps auxfFind processes by name:
ps aux | grep nginxShow specific columns:
ps -eo pid,ppid,user,%cpu,%mem,vsz,rss,stat,start,time,comm --sort=-%cpu | head -20Understanding ps Output Columns
- VSZ: Virtual memory size in kilobytes (total address space)
- RSS: Resident Set Size (actual physical memory used)
- STAT: Process state — R (running), S (sleeping), D (disk sleep), Z (zombie), T (stopped)
- START: Time when the process started
- TIME: Cumulative CPU time used
The difference between VSZ and RSS matters. A process might allocate a large virtual address space (high VSZ) but only touch a small portion of it (low RSS). VSZ tells you what the process requested; RSS tells you what it is actually using.
Signals: Talking to Processes
Linux processes communicate through signals. A signal is a software interrupt that tells a process to do something. The most common signals:
- SIGTERM (15): Graceful termination. The process can clean up resources, close connections, and exit properly. This is the default signal for
kill. - SIGKILL (9): Forced termination. The kernel immediately stops the process. No cleanup, no handlers. Use this only when SIGTERM does not work.
- SIGHUP (1): Hang up. Historically sent when a terminal disconnected. Many daemons reload their configuration when they receive SIGHUP.
- SIGSTOP (19): Pause the process. Cannot be caught or ignored.
- SIGCONT (18): Resume a stopped process.
- SIGINT (2): Interrupt. Same as pressing Ctrl+C in a terminal.
- SIGUSR1 (10) / SIGUSR2 (12): User-defined signals. Applications decide what these mean. Nginx uses SIGUSR1 to reopen log files.
Using kill Correctly
# Graceful shutdown (try this first)
kill <PID>

# Force kill (only if graceful fails)
kill -9 <PID>

# Reload configuration (for daemons that support it)
kill -HUP <PID>

# Send custom signal
kill -USR1 <PID>
Never start with kill -9. Always try kill (SIGTERM) first. If a process does not respond to SIGTERM after a reasonable wait (5-10 seconds), then escalate to SIGKILL. SIGKILL does not give the process a chance to close files, release locks, or notify dependent services.
Killing by Name
# Kill all nginx processes
pkill nginx

# Kill all processes matching a pattern
pkill -f "python.*server.py"

# Send a specific signal
pkill -HUP nginx
Process Priority and Scheduling
Linux uses the Completely Fair Scheduler (CFS) to allocate CPU time among processes. Every process has a priority level controlled by the nice value, which ranges from -20 (highest priority) to 19 (lowest priority).
Renicing Processes
# Start a command with lower priority
nice -n 10 tar czf backup.tar.gz /var/data/

# Change priority of a running process
renice -n -5 -p <PID>

# Change priority of all processes owned by a user
renice -n 5 -u www-data
For server workloads, the common pattern is to run background tasks (backups, indexing, log rotation) at a higher nice value so they yield CPU to production services. A nice value of 10-19 for background tasks and 0 for production services keeps things responsive.
Real-Time Scheduling
For latency-critical applications (audio processing, industrial control), Linux offers real-time scheduling policies: SCHED_FIFO and SCHED_RR. These give processes guaranteed CPU time and preempt normal processes. Use them carefully — a runaway real-time process can starve the entire system.
# Start a process with real-time priority
chrt -f 50 /path/to/critical-process

# Check a process's scheduling policy
chrt -p <PID>
Most server workloads do not need real-time scheduling. CFS is good enough for web servers, databases, and application servers.
systemd: Managing Services
On modern Linux systems, systemd is the init system that starts, stops, and manages services. It replaces the old SysV init scripts with a more powerful and consistent interface.
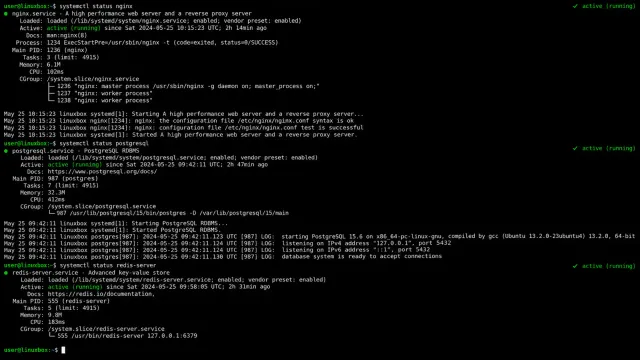
Basic systemd Commands
# Check service status
systemctl status nginx

# Start a service
sudo systemctl start nginx

# Stop a service
sudo systemctl stop nginx

# Restart a service
sudo systemctl restart nginx

# Reload configuration without downtime
sudo systemctl reload nginx

# Enable a service to start on boot
sudo systemctl enable nginx

# Disable a service from starting on boot
sudo systemctl disable nginx
Viewing Logs
systemd captures stdout and stderr from all managed services:
# View recent logs for a service
journalctl -u nginx

# Follow logs in real time
journalctl -u nginx -f

# View logs since a specific time
journalctl -u nginx --since "2026-08-27 10:00:00"

# View logs with priority filtering
journalctl -u nginx -p err
Creating a Custom Service
If you have a script or application that needs to run as a managed service, create a unit file:
# /etc/systemd/system/myapp.service
[Unit]
Description=My Application
After=network.target

[Service]
Type=simple
User=www-data
WorkingDirectory=/opt/myapp
ExecStart=/opt/myapp/start.sh
Restart=always
RestartSec=5

[Install]
WantedBy=multi-user.target
Then reload systemd and start the service:
sudo systemctl daemon-reload
sudo systemctl start myapp
sudo systemctl enable myapp
The Restart=always directive ensures the service restarts if it crashes. RestartSec=5 adds a 5-second delay between restarts to prevent rapid restart loops.
cgroups: Resource Control
Control groups (cgroups) are a kernel feature that lets you limit, account for, and isolate the resources used by process collections. They are the foundation of container technologies like Docker and Kubernetes.
Viewing cgroup Limits
# View cgroup v2 limits for a process
cat /proc/<PID>/cgroup

# Check memory limits
cat /sys/fs/cgroup/system.slice/nginx.service/memory.max

# Check CPU limits
cat /sys/fs/cgroup/system.slice/nginx.service/cpu.max
Setting Resource Limits with systemd
systemd makes cgroup management easy through unit file directives:
[Service]
# Limit memory to 512MB
MemoryMax=512M

# Limit CPU to 50% of one core
CPUQuota=50%

# Limit I/O
IOReadBandwidthMax=/dev/sda 50M
IOWriteBandwidthMax=/dev/sda 50M
These limits are enforced by the kernel. A process that exceeds its memory limit gets killed by the OOM killer. A process that exceeds its CPU limit gets throttled.
Practical cgroup Usage
For a multi-tenant server where you run multiple applications, cgroups prevent one misbehaving application from consuming all resources:
# Create a slice for your applications
sudo systemctl set-property myapp.service MemoryMax=1G CPUQuota=100%

# Check current resource usage
systemctl status myapp.service
This is especially important for shared hosting environments, development servers, or any system where multiple services compete for resources.
Process Monitoring Scripts
For ongoing monitoring, a simple script that logs process statistics can help you spot trends:
#!/bin/bash
# Log top 10 CPU and memory consumers every 5 minutes

LOGFILE="/var/log/process-monitor.log"

while true; do
    echo "=== $(date) ===" >> "$LOGFILE"
    echo "--- Top 10 CPU ---" >> "$LOGFILE"
    ps aux --sort=-%cpu | head -11 >> "$LOGFILE"
    echo "--- Top 10 Memory ---" >> "$LOGFILE"
    ps aux --sort=-%mem | head -11 >> "$LOGFILE"
    echo "" >> "$LOGFILE"
    sleep 300
done
For production systems, consider using established monitoring tools like Prometheus with node_exporter, Grafana, or Netdata, which provide dashboards, alerting, and historical data without custom scripting.
Troubleshooting Common Process Issues
Zombie processes: A zombie is a process that has finished executing but whose parent has not called wait() to read its exit status. Zombies do not consume resources (no CPU, no memory), but they do occupy a PID. Find them with ps aux | awk '$8=="Z"' and identify the parent. If the parent is a well-known daemon, restarting it usually cleans up zombies. If the parent is your own code, fix the wait() call.
High CPU usage: Use top or htop sorted by CPU to identify the culprit. If it is a database query, check slow query logs. If it is an application, check for infinite loops or unoptimized algorithms. If it is a system process (kswapd, kworker), the system is under memory or I/O pressure.
Runaway memory growth: Use ps aux --sort=-%mem to find the offender. Check if it is a memory leak (RSS growing over time) or legitimate high usage. For leaks, tools like valgrind or heaptrack can help identify the source. For legitimate usage, adjust cgroup memory limits or add more RAM.
Too many open files: The lsof command lists all open files for a process. If a process has thousands of open file descriptors, it may be leaking connections or file handles. Check application logs for error messages about “too many open files” and increase ulimits if needed:
# Check current limits
ulimit -n

# Increase for current session
ulimit -n 65536

# Make permanent via /etc/security/limits.conf
* soft nofile 65536
* hard nofile 65536
Related reads: Linux User and Group Management: A Complete Server Administration Guide | Linux Log Rotation and Disk Space Management: A Practical Guide | Linux Swap and ZRAM: A Complete Configuration Guide for Server Performance