Why Journalctl Replaces grep
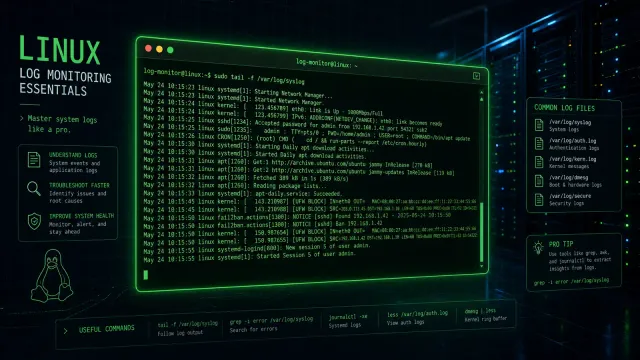
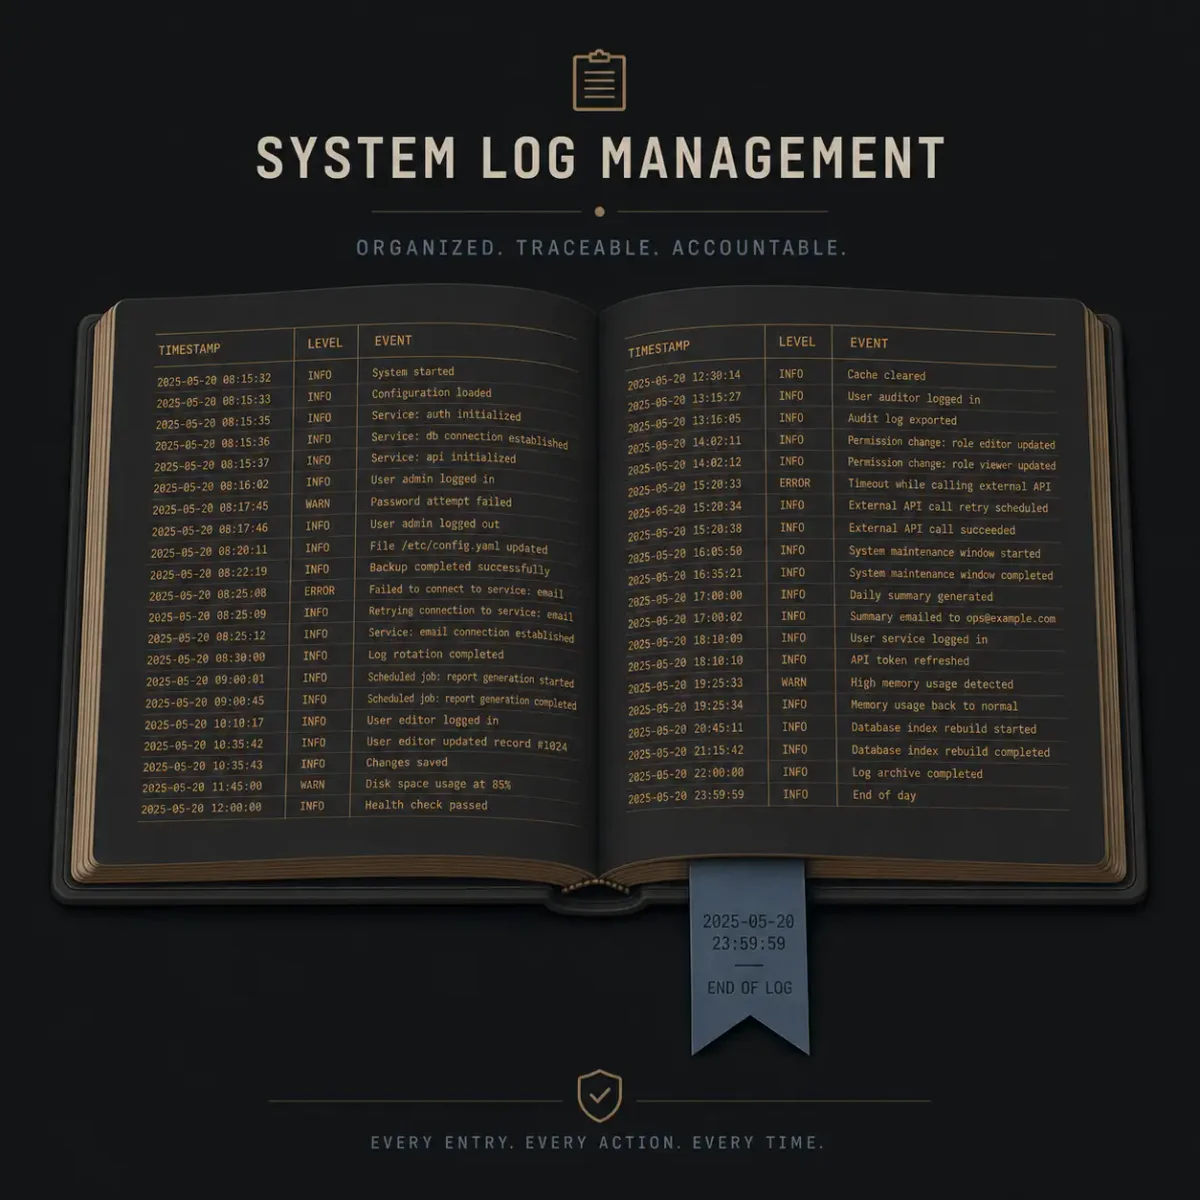
Systemd’s journal collects logs from the kernel, init, and every service into a binary store at /var/log/journal/. Unlike traditional syslog files, you query it rather than grep it. This means structured, filterable logs out of the box.
journalctl -b           # Current boot
journalctl -f           # Follow in real time
journalctl -u nginx     # One service only
journalctl -k           # Kernel messages
journalctl -n 50        # Last 50 lines
Time Filtering
The time filters are journalctl’s killer feature. No more grepping through rotated files:
journalctl --since "2026-04-03 14:00:00"
journalctl --until "2026-04-03 15:00:00"
journalctl --since "2 hours ago"
journalctl --since yesterday
Combine with unit filters for surgical precision:
journalctl -u docker.service --since "2 hours ago" --until "1 hour ago"Priority Filtering
Messages have priorities 0 (emerg) through 7 (debug). Filter by level:
journalctl -p err        # Errors and worse (0-3)
journalctl -p warning    # Warnings and worse (0-4)
Structured Output for Scripting
journalctl -u nginx -n 10 -o json          # JSON
journalctl -u nginx -n 10 -o json-pretty   # Pretty JSON
journalctl -n 5 -o verbose                 # All metadata
Use jq for advanced queries:
journalctl -u nginx --since "1 hour ago" -o json | \
  jq -r 'select(.MESSAGE | contains("timeout")) | .MESSAGE'
Persistent Storage
By default logs live in tmpfs and are lost on reboot. Enable persistence:
sudo mkdir -p /var/log/journal
sudo systemd-tmpfiles --create --prefix /var/log/journal
sudo systemctl restart systemd-journald
Configure retention in /etc/systemd/journald.conf:
[Journal]
Storage=persistent
SystemMaxUse=1G
SystemKeepFree=2G
MaxRetentionSec=4week
Check usage: journalctl --disk-usage
Boot-Specific Logs
Each boot gets a separate index:
journalctl --list-boots
journalctl -b -1    # Previous boot
journalctl -b -2    # Two boots ago
This is invaluable for crash diagnosis — logs from the failed boot survive the reboot.
Vacuum Old Logs
sudo journalctl --vacuum-time=2weeks
sudo journalctl --vacuum-size=500M
Production Workflow
When an alert fires: narrow the time window → filter by service → filter by priority → output as JSON → export relevant logs for the incident report. Journalctl turns log archaeology into structured queries.