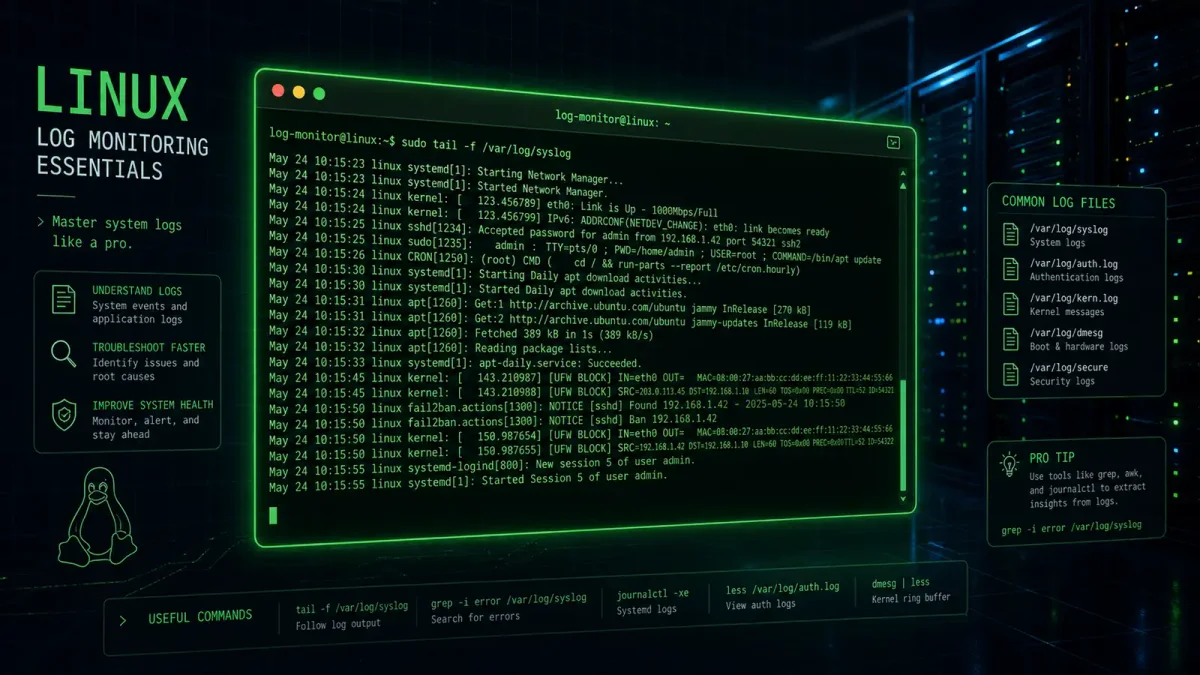
If you have ever typed tail -f /var/log/syslog on a systemd machine and waited for something to happen, this guide is for you. journalctl has been the default logging system on every major Linux distribution for the better part of a decade, and most administrators still use it like a slightly fancier grep. There is a lot more under the hood, and once you learn a handful of flags, you will stop reaching for the old tools entirely.
Why journalctl exists (and why you should care)
Before systemd-journald, Linux logging was a mess of text files in /var/log/. Each daemon wrote to its own file in its own format — Apache used one timestamp format, Postfix used another, and some applications did not timestamp their output at all, relying on the syslog daemon to prepend one. Correlating events across services meant grepping through multiple files and hoping the timestamps lined up well enough to reconstruct a sequence of events. If a disk filled up because a runaway process was spamming logs, you found out when SSH stopped working because /var was full — and by then, the logs that would have told you what happened were probably among the files the OOM killer decided to delete.
journald fixes this by storing logs in a structured binary format. Every log entry carries metadata — the service name, the PID, the UID, the boot ID, the message priority, and timestamps with microsecond precision — whether the application that generated the log knows about it or not. Because journald sits between the process and the log output, it captures all of this automatically. A Python script that prints “Error connecting to database” with no timestamp, no severity level, and no service identifier will still show up in journalctl with all of that metadata attached. You can query on any of these fields without knowing which file the log ended up in.
The tradeoff is that you cannot just cat a journal file. The binary format requires journalctl to read. Once you internalize a few query patterns, this stops feeling like a limitation and starts feeling like superpowers — you are querying a database of system events rather than grepping through flat files.
The queries you will use every day
Start with the basics, then build up. The commands below replace the most common tail, grep, and less workflows you have been using for years.
# Show all logs from the current boot
journalctl -b

# Show logs from the previous boot (useful after a crash)
journalctl -b -1

# Follow new log entries in real time (like tail -f)
journalctl -f

# Show only kernel messages (like dmesg)
journalctl -k

# Show logs since the last hour
journalctl --since "1 hour ago"

# Show logs between two timestamps
journalctl --since "2026-07-26 08:00:00" --until "2026-07-26 12:00:00"
The time-based filters are where journalctl starts pulling away from the old grep-based approach. Need to see everything that happened on a server between 2:00 AM and 2:15 AM last Tuesday? That is a single command with journalctl — journalctl --since "2026-07-21 02:00:00" --until "2026-07-21 02:15:00" — and you get every log entry from every service in chronological order. With traditional syslog files, you would be writing awk scripts to parse timestamps across multiple files, hoping the formats are consistent and that log rotation has not already shipped the relevant data to a compressed archive.
The --since and --until flags accept a wide range of human-readable time formats. “yesterday”, “today”, “1 hour ago”, “2026-07-20”, “last Monday” — journalctl’s time parser handles all of them. This alone saves minutes on every investigation compared to manually calculating timestamps for grep patterns.
Filtering by service: the one you will use most
If you learn exactly one journalctl pattern, make it this one. Filtering by systemd unit is the journalctl equivalent of tail -f /var/log/nginx/error.log, except you get stdout and stderr combined, with proper timestamps, and you can combine it with every other filter journalctl supports.
# See all logs for a specific systemd service
journalctl -u nginx.service

# Follow a service's logs in real time
journalctl -u nginx.service -f

# See logs for a service since the last boot
journalctl -u nginx.service -b

# Combine with time filters
journalctl -u nginx.service --since "30 minutes ago"
The -u flag accepts the full unit name including the .service suffix. You can also use shell-style glob patterns to match multiple units at once, which is useful on servers running multiple instances of the same service:
# Show logs from all Docker-related services
journalctl -u 'docker*'

# Show logs from all web server instances
journalctl -u 'nginx*' -u 'apache2*'
This alone replaces the workflow of tail -f /var/log/nginx/access.log and tail -f /var/log/nginx/error.log in separate terminal windows — and it works for services that do not write to traditional log files at all, such as containers managed by systemd or applications that log exclusively to stdout.
Filtering by priority: ignore the noise
Systemd uses the standard syslog priority levels. journalctl lets you filter by them, which means you can suppress the routine informational messages that make up 90% of most log output and focus on what is actually wrong.
# Show only errors and worse (priority 3 and below)
journalctl -p err

# Show only warnings and worse
journalctl -p warning

# Show critical alerts only
journalctl -p crit

# The full scale: emerg (0), alert (1), crit (2), err (3),
# warning (4), notice (5), info (6), debug (7)
The numeric scale maps to severity: 0 is “system is unusable,” 7 is “debug-level noise.” In practice, -p err is the sweet spot for most troubleshooting — it shows you errors, critical alerts, and emergency messages without burying you in warnings that may or may not be relevant.
Combine priority filtering with service filtering to zero in on what actually matters:
# Only NGINX errors from today
journalctl -u nginx.service -p err --since today
This is the kind of query that would require piping through multiple greps and awks with traditional log files. With journalctl, it is one flag.
Advanced filtering: JSON output and field matching
Because journald stores structured data, you can query on any field — not just the ones you see in the default output. This is where journalctl stops being a log viewer and starts being a log analysis tool. To see what fields are available on a specific entry:
# Show the last 5 log entries in verbose mode (all fields)
journalctl -n 5 -o verbose
The output shows every structured field: _UID, _PID, _SYSTEMD_UNIT, _BOOT_ID, _TRANSPORT, MESSAGE, and more — typically 20 to 30 fields per entry. Once you know the field names, you can filter on them directly without knowing which service or file generated the log.
# Show logs from a specific process ID
journalctl _PID=12345

# Show logs from a specific user
journalctl _UID=1000

# Show logs from a specific executable path
journalctl _EXE=/usr/bin/sshd
The _EXE filter is particularly useful for tracking down what a specific binary is doing across services. If you are troubleshooting an SSH issue and want to see everything the sshd binary has logged — regardless of which unit or service it is running under — _EXE=/usr/bin/sshd gets you exactly that.
For scripting and log analysis pipelines, JSON output turns journalctl into a data source you can feed into any tool that speaks JSON:
# Output the last 100 entries as JSON
journalctl -n 100 -o json

# Pretty-print with jq
journalctl -n 100 -o json | jq '.'

# Count errors by service in the last hour
journalctl --since "1 hour ago" -p err -o json | jq -r '.__REALTIME_TIMESTAMP + " " + ._SYSTEMD_UNIT' | sort | uniq -c | sort -rn
Feeding journalctl -o json into jq opens up programmatic log analysis that would be painful with text files: aggregating by service, counting error rates by hour, finding the top error messages, joining with other data sources. You can build monitoring dashboards, alerting pipelines, and forensic analysis scripts entirely on top of journalctl’s JSON output without touching a log file directly.
Managing disk usage: journald will eat your disk if you let it
By default, journald stores logs in /var/log/journal/ and has a size limit — but the default limit varies by distribution and can be surprisingly generous. On a busy web server logging every HTTP request through systemd, or a Docker host where every container’s stdout flows through journald, the journal can grow to multiple gigabytes within weeks. If you have ever run df -h and discovered that /var/log/journal/ is consuming 4GB, you understand why this section exists.
Check current disk usage with a single command:
# Show journal disk usage
journalctl --disk-usage
This prints the total size of all archived and active journal files. If the number surprises you, set explicit limits in /etc/systemd/journald.conf:
[Journal]
SystemMaxUse=500M
SystemKeepFree=1G
MaxFileSec=1month
SystemMaxUse caps the total journal size. SystemKeepFree tells journald to stop writing when the filesystem has less than 1GB free. MaxFileSec rotates individual journal files after a month. The combination of these three settings keeps journal disk usage predictable — which, on a production server, is more important than keeping every log entry forever.
Apply the changes:
systemctl restart systemd-journaldFor immediate cleanup without changing the configuration, the vacuum commands delete old entries in place:
# Keep only the last 2 days of logs
journalctl --vacuum-time=2d

# Keep only the last 500MB of logs
journalctl --vacuum-size=500M

# Keep only the most recent 5000 log entries
journalctl --vacuum-files=5000
The vacuum commands respect the configured limits in journald.conf, so a --vacuum-size=500M command will only reduce usage below your configured SystemMaxUse. If you are in a crunch and need to force a smaller size, adjust the config first, restart journald, then run the vacuum command.
Persistent storage across reboots
By default on many distributions, journald only keeps logs in memory and discards them on reboot. If you want persistent logs that survive reboots:
mkdir -p /var/log/journal
systemctl restart systemd-journald
Once /var/log/journal/ exists, journald automatically switches to persistent storage. The logs from the current boot will also be preserved going forward. Existing in-memory logs from the current boot are not retroactively persisted, so create the directory before you need the logs.
Boot-specific queries: finding the crash
When a server crashes and reboots, the logs from the failed boot are often the only clue about what went wrong. journalctl makes this easy:
# List all recorded boots with their IDs
journalctl --list-boots

# Show logs from a specific boot ID
journalctl -b <boot-id>

# Show logs from the previous boot
journalctl -b -1

# Show logs from 3 boots ago
journalctl -b -3
Combine with priority filtering to quickly surface what went wrong:
# Errors from the boot that crashed
journalctl -b -1 -p err
This is where journalctl replaces the old workflow of digging through /var/log/syslog.1 and hoping the log rotation caught the crash before the file was overwritten.
Kernel messages: modern dmesg
The -k flag filters to kernel messages, which is functionally equivalent to dmesg but with all the journalctl query capabilities:
# Kernel messages from current boot
journalctl -k

# Kernel messages from the previous boot (check what happened before a crash)
journalctl -k -b -1

# Kernel errors only
journalctl -k -p err

# Kernel messages since last hour
journalctl -k --since "1 hour ago"
Practical patterns: real workflows
Here are a few patterns you will actually use in production. These are not contrived examples — they are the commands you run when something is broken and you need answers right now.
Investigating a service outage:
# What happened to nginx in the last hour?
journalctl -u nginx.service --since "1 hour ago" -p warning

# What else was happening on the system at the same time?
journalctl --since "1 hour ago" -p err | grep -v nginx
The second command filters out the nginx errors you already know about so you can see if the database, the network stack, or the kernel was also complaining during the outage window. This kind of cross-service correlation is what journalctl is built for.
Post-reboot health check after applying updates:
# Any errors since the server came back up?
journalctl -b -p err

# Did the important services start cleanly?
journalctl -u sshd.service -b
journalctl -u docker.service -b
Run these after a kernel update or a systemctl daemon-reload. If Docker failed to start because of a configuration change you forgot about, you will see it here before a user reports that a container is down.
Real-time troubleshooting as you reproduce an issue:
# Watch nginx and postgres simultaneously
journalctl -u nginx.service -u postgresql.service -f
This streams logs from both services in a single interleaved timeline. When a user reports a 500 error at 14:32:17, you can see the nginx error log and the PostgreSQL query log from the same second side by side. No more switching between terminal tabs trying to mentally align timestamps.
Disk space emergency:
# How much space are logs using?
journalctl --disk-usage

# Emergency cleanup: keep only the last 24 hours
journalctl --vacuum-time=1d
If /var is 98% full and you need breathing room to investigate, --vacuum-time=1d drops everything older than a day — usually freeing hundreds of megabytes instantly. Just remember to set permanent limits in journald.conf afterward so you do not end up in the same situation next week.
The bottom line
journalctl is not just a replacement for tail and grep. It is a query engine for system events. Once you stop thinking of logs as text files and start thinking of them as a structured dataset — indexed by time, service, priority, boot, PID, and dozens of other fields — the way you troubleshoot changes. You spend less time finding the relevant logs and more time understanding what they mean.
If you are still grepping through /var/log/, take ten minutes to learn the flags above. Your future self, SSH’d into a server at 3 AM trying to figure out why production is down, will thank you.