Introduction
If you’ve spent any time managing servers or deploying applications, you know the pain of doing things manually. One missed configuration, one forgotten step, and suddenly your Friday night is gone. DevOps automation fixes that — and in 2026, the tooling has gotten seriously good.
This tutorial covers 20+ tools across infrastructure management, CI/CD, monitoring, and a newer category: MCP servers that let AI assistants talk directly to your DevOps stack. We’ll look at when to pick Terraform over Ansible, how Prometheus and Grafana fit together, and what MCP servers actually do in practice.
What you’ll learn:
- Linux power tools for DevOps engineers
- Infrastructure as Code with Terraform, Ansible, and Helm
- CI/CD automation with GitHub Actions and GitLab
- Monitoring and observability best practices
- How MCP servers integrate AI into DevOps workflows
Time required: 25 minutes Difficulty level: Intermediate
Prerequisites
Before diving into these tools, you should have:
- Basic Linux command line experience
- Understanding of Git version control
- Familiarity with cloud platforms (AWS, Azure, or GCP)
- Docker and containerization concepts
Tools needed:
- A Linux or macOS terminal
- Git installed
- Access to a cloud account (optional for hands-on practice)
- Text editor or AI assistant
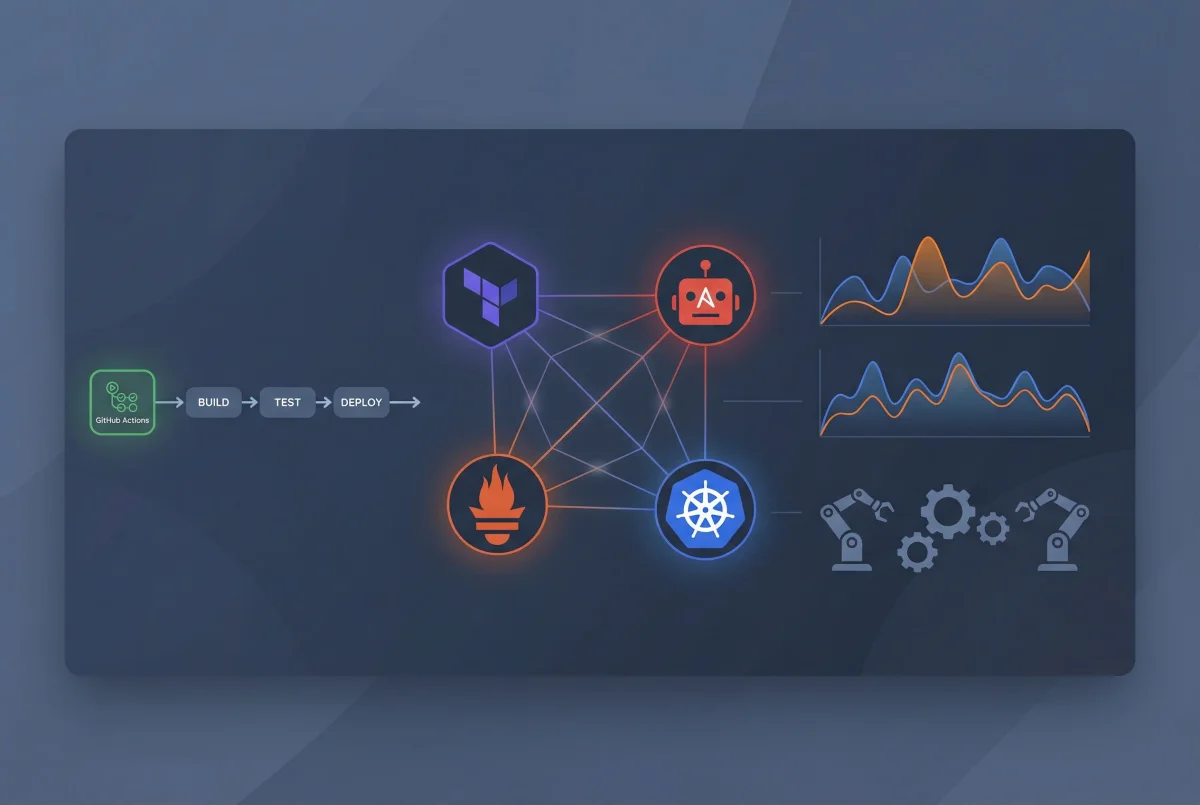
How DevOps automation works in 2026
At its core, DevOps automation removes the human from repetitive tasks. You stop manually deploying code, hand-configuring servers, or grepping through logs at 2 AM. Tools do it for you — consistently, every single time.
The landscape shifted quite a bit over the past few years. Infrastructure as Code went from “nice to have” to table stakes. Teams write their entire infrastructure in version-controlled files instead of clicking around cloud consoles. Observability tools got smarter too — they don’t just flag that something broke, they show you the trail of breadcrumbs leading to the root cause. And MCP servers? They’re the newest addition, letting AI assistants plug directly into your ops toolchain.
Industry surveys show roughly 73% of enterprises now run some form of AIOps to wrangle complex systems and cut through alert noise. The whole field is moving from “react when things break” to “catch problems before users notice.” That only works with solid automation underneath.
Part 1: Linux power tools
Linux runs most of the infrastructure you’ll touch — CI/CD agents, Kubernetes nodes, containers. Getting comfortable with Linux tooling pays off fast when you’re debugging at 3 AM or automating a deployment pipeline.
Modern terminal tools
Your terminal is home base. htop gives you a real-time view of what’s eating CPU and memory — way more readable than plain top. And if you’re jumping between servers, tmux keeps your sessions alive even when your SSH connection drops.
Two tools worth installing right away: fd (a faster, friendlier find) and ripgrep (rg, which blows grep out of the water on large codebases). Both respect .gitignore by default, which saves you from wading through node_modules results.
Git and GitOps helpers
Git is the glue holding DevOps together. lazygit wraps Git in a terminal UI that makes rebasing and cherry-picking less painful. On the GitOps side, flux and argocd watch your Git repos and automatically sync changes to Kubernetes — push to main, and your cluster updates itself.
The gh CLI from GitHub lets you manage repositories, pull requests, and issues without leaving the terminal:
# Create a pull request
gh pr create --title "Add monitoring config" --body "Adds Prometheus configuration"

# Check CI status
gh pr checks
System monitoring and debugging
Things break. When they do, you want answers fast. dstat shows CPU, disk, network, and memory stats in a single view — no switching between tools. mtr combines ping and traceroute so you can spot exactly where a network path falls apart.
For containers, dive lets you inspect Docker image layers to find what’s bloating your images. And k9s gives you a terminal dashboard for Kubernetes that’s genuinely faster than typing kubectl commands over and over.
Part 2: Infrastructure as Code tools
IaC flips infrastructure management on its head. Instead of SSH-ing into servers and running commands, you describe what you want in code, commit it to Git, and let tools build it. Three tools dominate this space, and they each solve different problems.
Terraform: infrastructure provisioning
Terraform specializes in creating and managing cloud infrastructure. It uses a declarative approach where you define the desired end state, and Terraform figures out how to get there. The tool maintains a state file tracking every resource it manages.
Terraform works well for provisioning infrastructure from scratch. Need to spin up a VPC with subnets, security groups, and EC2 instances? Terraform handles the dependencies automatically:
resource "aws_vpc" "main" {
  cidr_block = "10.0.0.0/16"

  tags = {
    Name = "production-vpc"
  }
}

resource "aws_subnet" "public" {
  vpc_id     = aws_vpc.main.id
  cidr_block = "10.0.1.0/24"

  tags = {
    Name = "public-subnet"
  }
}
The declarative syntax makes infrastructure changes reviewable through pull requests. Teams can see what will change before applying updates. Terraform’s state file enables drift detection, alerting you when production infrastructure diverges from code.
Ansible: configuration management
While Terraform builds infrastructure, Ansible configures it. Ansible uses a procedural approach with playbooks written in YAML. It connects to servers via SSH and executes tasks in sequence.
Ansible works well for Day 1 and Day 2 operations. After Terraform provisions servers, Ansible installs software, applies security patches, and manages configurations. The tool is agentless, requiring no special software on managed nodes:
- name: Configure web servers
  hosts: webservers
  tasks:
    - name: Install nginx
      apt:
        name: nginx
        state: present

    - name: Copy configuration
      template:
        src: nginx.conf.j2
        dest: /etc/nginx/nginx.conf
      notify: restart nginx

  handlers:
    - name: restart nginx
      service:
        name: nginx
        state: restarted
Ansible’s idempotent modules ensure tasks only make changes when needed. Running the same playbook multiple times produces the same result without unnecessary modifications.
Helm: Kubernetes package management
Helm manages Kubernetes applications through charts, which are packages of pre-configured Kubernetes resources. Instead of maintaining dozens of YAML files, you define values and let Helm generate the manifests.
Charts make deploying complex applications straightforward. A single command can deploy an entire application stack:
# Add a chart repository
helm repo add bitnami https://charts.bitnami.com/bitnami

# Install PostgreSQL
helm install my-database bitnami/postgresql \
  --set auth.postgresPassword=secretpassword \
  --set primary.persistence.size=20Gi
Helm handles upgrades and rollbacks reliably. If a deployment fails, rolling back to the previous version takes one command.
Choosing the right tool
The best approach uses these tools together. Terraform provisions the infrastructure (VPCs, Kubernetes clusters, databases). Ansible configures the base systems (security policies, monitoring agents, user accounts). Helm deploys applications into Kubernetes.
Red Hat’s guidance confirms this pattern: use Terraform for Day 0 provisioning, Ansible for Day 1 configuration and Day 2 operations. The tools complement rather than compete with each other.
Part 3: CI/CD pipeline automation
Continuous Integration and Continuous Delivery pipelines automate testing and deployment. Every code commit triggers automated builds, tests, and deployments.
GitHub Actions
GitHub Actions integrates CI/CD into GitHub repositories. Workflows trigger on events like pushes, pull requests, or schedules. The platform offers 30,000 free credits monthly for private repositories.
Actions use YAML workflow files stored in .github/workflows/:
name: CI Pipeline
on: [push, pull_request]

jobs:
  test:
    runs-on: ubuntu-latest
    steps:
      - uses: actions/checkout@v3

      - name: Set up Node.js
        uses: actions/setup-node@v3
        with:
          node-version: '18'

      - name: Install dependencies
        run: npm ci

      - name: Run tests
        run: npm test

      - name: Build application
        run: npm run build
The marketplace offers thousands of pre-built actions for common tasks. Need to deploy to AWS, send Slack notifications, or scan for security vulnerabilities? There’s an action for that.
GitLab CI/CD
GitLab provides an all-in-one platform combining version control, CI/CD, and security scanning. Pipelines are defined in .gitlab-ci.yml files at the repository root. GitLab runners execute jobs in containers, VMs, or Kubernetes pods.
GitLab’s strength is platform consolidation. Instead of integrating separate tools, everything lives in one interface. Forrester named GitLab a Leader in their 2025 DevOps Platforms Wave for this unified approach.
CircleCI
CircleCI leads with transparent pricing and publicly available per-resource costs. The platform provides 30,000 free credits monthly with automatic refills on paid plans. Open source projects receive 400,000 credits.
CircleCI works well for complex workflows with dependencies between jobs. You can fan out parallel tests, then fan in for deployment. The platform’s orbs (reusable configuration packages) speed up pipeline creation.
Part 4: Monitoring and observability
Monitoring tells you when something breaks. Observability tells you why. Modern DevOps requires both, using metrics, logs, and traces to understand system behavior.
Prometheus and Grafana
This open-source combination is widely used for cloud-native monitoring. Prometheus collects time-series metrics by scraping HTTP endpoints on your services. Grafana visualizes Prometheus data through customizable dashboards.
You can plot CPU usage, request latency, error rates, and custom business metrics. Grafana also handles alerting, sending notifications when thresholds are breached:
# Prometheus alert rule
groups:
  - name: api_alerts
    rules:
      - alert: HighErrorRate
        expr: rate(http_requests_total{status=~"5.."}[5m]) > 0.05
        for: 10m
        annotations:
          summary: "High error rate detected"
          description: "Error rate is {{ $value }} requests/sec"
By 2025, three-quarters of DevOps teams were using Prometheus in production. The number continues growing in 2026 as Kubernetes adoption increases. Prometheus integrates naturally with Kubernetes through service discovery.
ELK Stack for log management
The ELK Stack (Elasticsearch, Logstash, Kibana) provides centralized logging. Logstash collects logs from various sources, Elasticsearch indexes them for fast searching, and Kibana offers a web UI for analysis.
Centralized logging speeds up troubleshooting. Instead of SSH-ing into individual servers to tail log files, you query Elasticsearch through Kibana. Search for error messages, filter by time range, and visualize patterns across your entire infrastructure.
For cloud-native environments, Grafana Loki offers a lighter alternative. Loki indexes only metadata labels rather than full log text, making it cheaper to run at scale.
Distributed tracing with Jaeger
Microservices architectures need distributed tracing to follow requests across services. Jaeger captures trace spans showing each step a request takes through your system. The UI visualizes the entire journey, highlighting where delays or errors occur.
OpenTelemetry has become the industry standard for instrumentation. It provides vendor-neutral SDKs for capturing metrics, logs, and traces. Instrument your code once with OpenTelemetry, then send data to any backend — Jaeger, Prometheus, Elastic, or commercial platforms.
Part 5: MCP servers and AI integration
Model Context Protocol (MCP) servers connect AI assistants with DevOps tools. Introduced in late 2024, MCP enables natural language commands to trigger multi-step operations across your infrastructure.
What are MCP servers?
MCP provides a standard way for AI agents to interact with external tools and data. Instead of manually running commands, you can tell an AI assistant “deploy the staging app” or “show me the resource tree for the guestbook application,” and the MCP server handles the execution.
MCP servers expose tools that AI agents can invoke. The GitHub MCP server provides tools for repository operations, creating issues, and managing CI/CD through GitHub Actions. The Terraform MCP server lets agents generate and manage Terraform configurations.
10 MCP servers for DevOps
1. GitHub MCP server — Enables AI agents to perform repository operations, manage issues and pull requests, and control GitHub Actions workflows. Mirrors GitHub’s API capabilities for automating complex Git workflows.
2. Terraform MCP server — HashiCorp’s server integrates with Terraform Registry APIs and Terraform Enterprise. Agents can query module metadata, inspect workspace states, and trigger runs with human approval.
3. Argo CD MCP server — Developed by Akuity, this server wraps the Argo CD API for Kubernetes GitOps workflows. Retrieve application information, sync deployments, and manage resources through natural language.
4. Grafana MCP server — Surfaces observability data to AI agents. Query dashboard details, fetch monitoring data, and retrieve incident information with optimized responses to minimize token usage.
5. GitLab MCP server — Available for GitLab Premium and Ultimate customers. Create issues, manage merge requests, and search across GitLab projects through AI agents.
6. Snyk MCP server — Scans for security vulnerabilities in code, dependencies, IaC configurations, and containers. Integrates security scanning into AI-assisted DevOps workflows.
7. AWS MCP servers — AWS offers dozens of specialized MCP servers. The Lambda Tool server manages Lambda functions. The S3 Tables server handles S3 operations. The Knowledge server provides access to current AWS documentation.
8. Atlassian MCP server — Connect AI tools with Jira and Confluence. Create and update Jira issues, retrieve Confluence documentation, and chain related actions across both platforms.
9. Notion MCP server — Helps agents access team documentation and process guides. Reference internal runbooks, style guides, and operational procedures stored in Notion.
10. Pulumi MCP server — An alternative to Terraform for IaC. Query your organization’s registry, execute Pulumi commands, and provision infrastructure through natural language.
MCP integration best practices
Start with read-only permissions when testing MCP servers. AI agents are based on nondeterministic LLMs, making their behavior unpredictable. Granting write access to production systems without testing creates risk.
Use MCP servers with trusted LLMs and clients only. Avoid exposing high-value, long-lived credentials to MCP clients. Consider short-lived tokens and least-privilege access patterns.
Best practices and tips
Start with Infrastructure as Code — Version control everything. Store Terraform configurations, Ansible playbooks, and Kubernetes manifests in Git. Use pull requests for infrastructure changes just like application code.
Implement meaningful alerts — Configure alerts on symptoms that need human attention. Alert when error rates surge AND response times increase, not just when CPU spikes. Tie every alert to a runbook explaining how to respond.
Automate testing in pipelines — Run unit tests, integration tests, and security scans in every CI/CD pipeline. Use tools like Snyk for dependency scanning and SonarQube for code quality analysis.
Monitor metrics, logs, and traces — Use Prometheus for metrics, ELK or Loki for logs, and Jaeger for traces. Make sure these systems integrate so you can correlate data during incidents.
Practice chaos engineering — Test your monitoring and automation by breaking things in staging. Kill services, overload CPUs, fill disks. Verify that your alerts fire and your team can troubleshoot using available tools.
Common problems and solutions
Problem: Tool integration complexity — Different tools use different configuration formats and APIs. Solution: Use Infrastructure as Code to manage tool configurations. Store Prometheus rules, Grafana dashboards, and alert configurations in Git.
Problem: Alert fatigue — Too many alerts lead to ignored notifications and missed issues. Solution: Implement alert aggregation and intelligent routing. Use tools like PagerDuty or Opsgenie to deduplicate alerts. Review and tune alert thresholds regularly.
Problem: Secrets management — Hardcoded credentials in code create security risks. Solution: Use dedicated tools like AWS Secrets Manager, Azure Key Vault, or HashiCorp Vault. Rotate credentials automatically and audit access.
Problem: Kubernetes complexity — Kubernetes has a steep learning curve and operational overhead. Solution: Consider serverless container platforms like AWS Fargate or Google Cloud Run for simpler use cases. If you need Kubernetes, use managed services (EKS, AKS, GKE) and tools like k9s for easier cluster operations.
Summary
DevOps automation in 2026 covers every stage of the software delivery lifecycle. Terraform and Ansible handle infrastructure provisioning and configuration. GitHub Actions and GitLab automate CI/CD pipelines. Prometheus, Grafana, and the ELK Stack provide observability. MCP servers bridge AI assistants and DevOps workflows.
The key is choosing tools that work together. Start with open-source standards like Prometheus and Terraform. Add cloud-native services where they simplify operations. Experiment with MCP servers to see how AI can fit into your workflows.
Next steps:
- Set up a basic monitoring stack with Prometheus and Grafana
- Create a CI/CD pipeline with GitHub Actions
- Experiment with Terraform to provision cloud resources
- Explore MCP servers with an AI-assisted development tool
Related resources: