Alertmanager Architecture
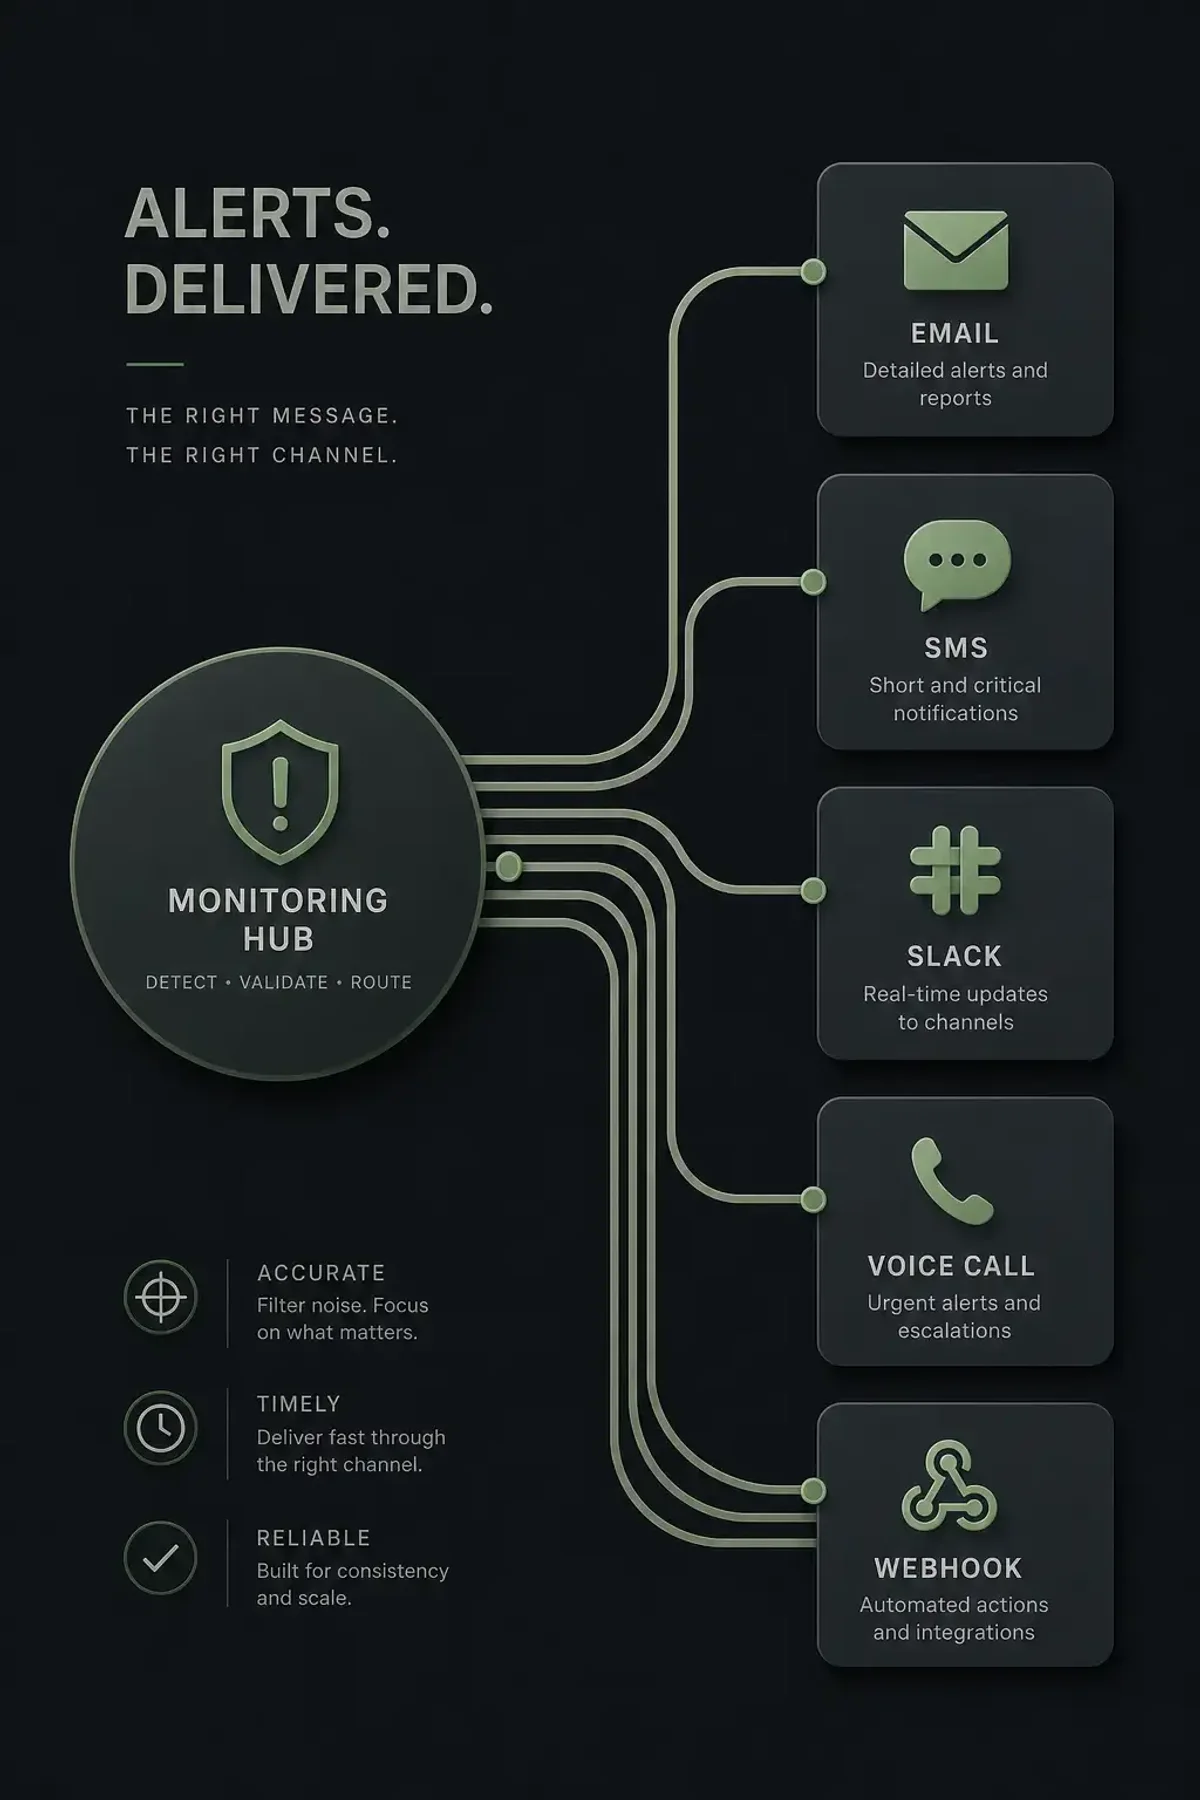
Prometheus evaluates alerting rules and fires alerts. Alertmanager takes those alerts and handles deduplication, grouping, routing, and notification delivery. Without Alertmanager, every firing alert generates a separate email — with it, you get one digest per incident.
The pipeline: Prometheus → Alertmanager (dedup → group → inhibit → silence) → PagerDuty/Slack/Email.
Installation
wget https://github.com/prometheus/alertmanager/releases/download/v0.27.0/alertmanager-0.27.0.linux-amd64.tar.gz
tar xzf alertmanager-0.27.0.linux-amd64.tar.gz
sudo cp alertmanager-0.27.0/alertmanager /usr/local/bin/
sudo cp alertmanager-0.27.0/amtool /usr/local/bin/
Systemd unit:
[Unit]
Description=Alertmanager
After=network-online.target

[Service]
User=alertmanager
ExecStart=/usr/local/bin/alertmanager \
  --config.file=/etc/alertmanager/alertmanager.yml \
  --storage.path=/var/lib/alertmanager

[Install]
WantedBy=multi-user.target
Core Configuration
/etc/alertmanager/alertmanager.yml:
global:
  resolve_timeout: 5m
  slack_api_url: 'https://hooks.slack.com/services/xxx'

route:
  receiver: 'default'
  group_by: ['alertname', 'cluster']
  group_wait: 10s
  group_interval: 10m
  repeat_interval: 4h

receivers:
  - name: 'default'
    slack_configs:
      - channel: '#alerts'
        title: '[{{ .Status | toUpper }}] {{ .CommonLabels.alertname }}'
        text: '{{ range .Alerts }}{{ .Annotations.description }}
{{ end }}'
Key timing parameters:
group_wait: How long to wait for additional alerts before sending the first notification (groups related alerts)group_interval: Minimum time between notification sends for the same grouprepeat_interval: How often to re-send if the alert is still firing (4h default prevents noise)
Routing Rules
Route alerts to different channels based on severity or team:
route:
  receiver: 'default'
  group_by: ['alertname']
  routes:
    - match:
        severity: critical
      receiver: 'pagerduty-critical'
      repeat_interval: 1h
    - match:
        severity: warning
      receiver: 'slack-warnings'
    - match_re:
        service: '^(database|cache)$'
      receiver: 'dba-team'
      continue: true
continue: true means the alert also matches parent routes after this one — useful for sending to both a team channel and a general channel.
Inhibition Rules
Suppress alerts when a higher-priority alert is already firing:
inhibit_rules:
  - source_match:
      alertname: 'InstanceDown'
    target_match_re:
      alertname: '.*'
    equal: ['instance']
When InstanceDown fires for a host, suppress all other alerts from that host. No point alerting about high CPU on a machine that’s unreachable.
Silence Management
Create silences for planned maintenance:
# Via amtool
amtool silence add \
  --alertname="HighMemoryUsage" \
  --instance="web-01:9090" \
  --duration=2h \
  --comment="Planned deployment"

# List active silences
amtool silence query

# Expire a silence
amtool silence expire <silence-id>
Receiver Examples
PagerDuty:
receivers:
  - name: 'pagerduty-critical'
    pagerduty_configs:
      - routing_key: 'your-integration-key'
        severity: 'critical'
description: '{{ .CommonAnnotations.description }}'Email:
receivers:
  - name: 'email-admins'
    email_configs:
      - to: 'oncall@example.com'
        from: 'alertmanager@example.com'
        smarthost: 'smtp.example.com:587'
        auth_username: 'alertmanager@example.com'
auth_password: 'app-password'OpsGenie:
receivers:
  - name: 'opsgenie'
    opsgenie_configs:
      - api_key: 'your-api-key'
        message: '{{ .CommonAnnotations.summary }}'
        priority: '{{ if eq .CommonLabels.severity "critical" }}P1{{ else }}P3{{ end }}'
Testing Configuration
Always test before deploying:
alertmanager --config.file=/etc/alertmanager/alertmanager.yml --dry-run
amtool check-config /etc/alertmanager/alertmanager.yml
Send a test alert:
curl -H "Content-Type: application/json" -d '[{
  "labels": {"alertname": "TestAlert", "severity": "critical"},
  "annotations": {"summary": "This is a test"}
}]' http://localhost:9093/api/v1/alerts
Prometheus Integration
In prometheus.yml:
alerting:
  alertmanagers:
    - static_configs:
        - targets: ['localhost:9093']

rule_files:
  - 'alerts/*.yml'
Example alert rule:
groups:
  - name: instance
    rules:
      - alert: InstanceDown
        expr: up == 0
        for: 5m
        labels:
          severity: critical
        annotations:
          summary: "Instance {{ $labels.instance }} down"
          description: "{{ $labels.instance }} has been down for more than 5 minutes."
High Availability
Run multiple Alertmanager instances behind a load balancer. They gossip to deduplicate notifications across instances:
alertmanager:
  cluster:
    peers:
      - alertmanager-1:9094
      - alertmanager-2:9094
With HA, only one instance sends the notification even if both receive the same alert from Prometheus.
Summary
Start with a simple config: one route, Slack receiver, sensible group intervals. Add routing rules and inhibition as your alert volume grows. The group_interval and repeat_interval settings are your best defense against alert fatigue.