Why Monitor Container Resources
A single container with a memory leak can drag down your entire Docker host. Docker provides resource limits, but limits only help if you know your actual usage patterns. Monitoring gives you the data to set sensible limits and catch problems before they cause outages.
Built-in Docker Stats
The quickest way to see container resource usage:
docker statsThis streams CPU percentage, memory usage, network I/O, and block I/O for all running containers. For a one-shot snapshot:
docker stats --no-streamFormat the output for scripting:
docker stats --no-stream --format "table {{.Name}}\t{{.CPUPerc}}\t{{.MemUsage}}\t{{.MemPerc}}"cAdvisor for Detailed Metrics
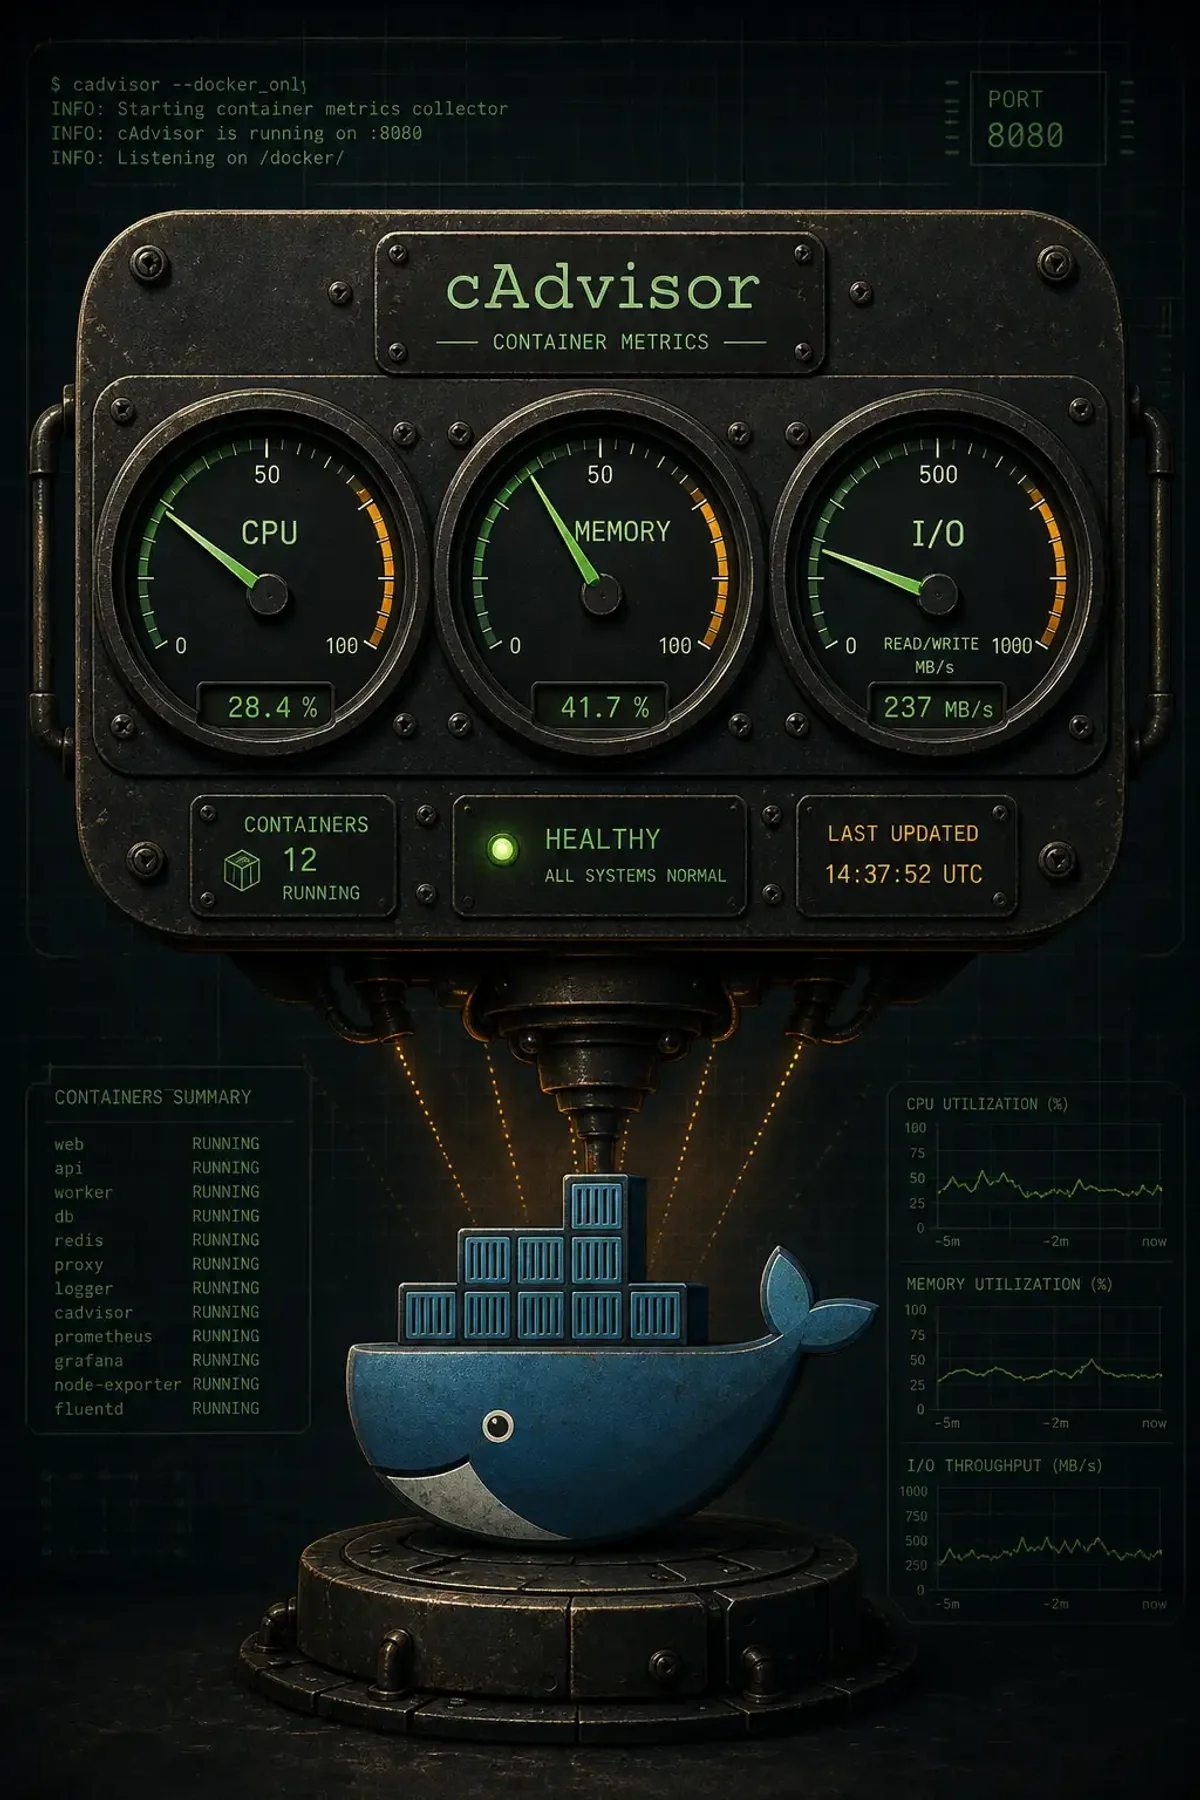
cAdvisor (Container Advisor) is Google’s purpose-built container monitoring tool. Run it as a container:
docker run -d \
  --name=cadvisor \
  --volume=/:/rootfs:ro \
  --volume=/var/run:/var/run:ro \
  --volume=/sys:/sys:ro \
  --volume=/var/lib/docker/:/var/lib/docker:ro \
  --volume=/dev/disk/:/dev/disk:ro \
  --publish=8080:8080 \
  --restart=always \
  gcr.io/cadvisor/cadvisor:latest
Access the web UI at http://your-server:8080. cAdvisor provides:
- Per-container CPU, memory, disk, and network graphs
- Historical data (configurable retention)
- Prometheus metrics endpoint (
/metrics)
Prometheus Integration
cAdvisor exposes Prometheus metrics natively. Add to your prometheus.yml:
scrape_configs:
  - job_name: 'cadvisor'
    scrape_interval: 15s
    static_configs:
      - targets: ['localhost:8080']
Key Prometheus queries for Docker monitoring:
# Container memory usage (bytes)
container_memory_usage_bytes{name="my-app"}

# CPU usage rate
rate(container_cpu_usage_seconds_total{name="my-app"}[5m])

# Network received bytes per second
rate(container_network_receive_bytes_total{name="my-app"}[5m])

# Disk I/O
rate(container_fs_writes_bytes_total{name="my-app"}[5m])
Grafana Dashboard Setup
Import the cAdvisor dashboard (ID: 193) from Grafana’s dashboard library. Key panels to watch:
- CPU throttling: If a container hits its CPU limit frequently, increase the limit
- Memory usage vs limit: Memory approaching the limit means potential OOM kills
- Disk I/O spikes: Sudden I/O spikes often indicate a problem (log storms, corrupted databases)
Inspecting Individual Containers
For deep dives into a specific container:
# Process list inside container
docker top my-container

# Detailed inspect output
docker inspect my-container | jq '.[0].State'

# Resource usage from cgroups
cat /sys/fs/cgroup/system.slice/docker-$(docker inspect -f '{{.Id}}' my-container).scope/memory.current
Setting Resource Limits Based on Data
After a week of monitoring, you know your application’s real usage. Set limits accordingly:
docker run -d \
  --cpus="1.5" \
  --memory="512m" \
  --memory-swap="1g" \
  --name my-app \
  my-image:latest
A good rule: set memory limit to 1.5x the 95th percentile observed usage, and CPU limit to match the container’s average usage plus 50% headroom for spikes.
Alerting Rules
Set Prometheus alert rules for Docker resource issues:
groups:
  - name: docker_alerts
    rules:
      - alert: ContainerHighMemory
        expr: container_memory_usage_bytes / container_spec_memory_limit_bytes > 0.9
        for: 5m
        labels:
          severity: warning
        annotations:
          summary: "Container memory usage above 90%"

      - alert: ContainerCPUThrottling
        expr: rate(container_cpu_cfs_throttled_seconds_total[5m]) > 0
        for: 10m
        labels:
          severity: warning
        annotations:
          summary: "Container experiencing CPU throttling"
Log-Based Monitoring
Container logs often contain the first signs of trouble:
# Monitor for error patterns
docker logs my-app 2>&1 | grep -i "error\|fatal\|panic" | tail -20

# Stream logs and filter
docker logs -f my-app 2>&1 | grep --line-buffered -i "error"
For production, ship logs to a centralized system (Loki, ELK, CloudWatch) and set up pattern-based alerts there.
Summary
Start with docker stats for quick checks, add cAdvisor for detailed metrics, integrate with Prometheus/Grafana for dashboards and alerting, then use real usage data to set appropriate resource limits. Monitoring without limits is just watching things fail in slow motion.