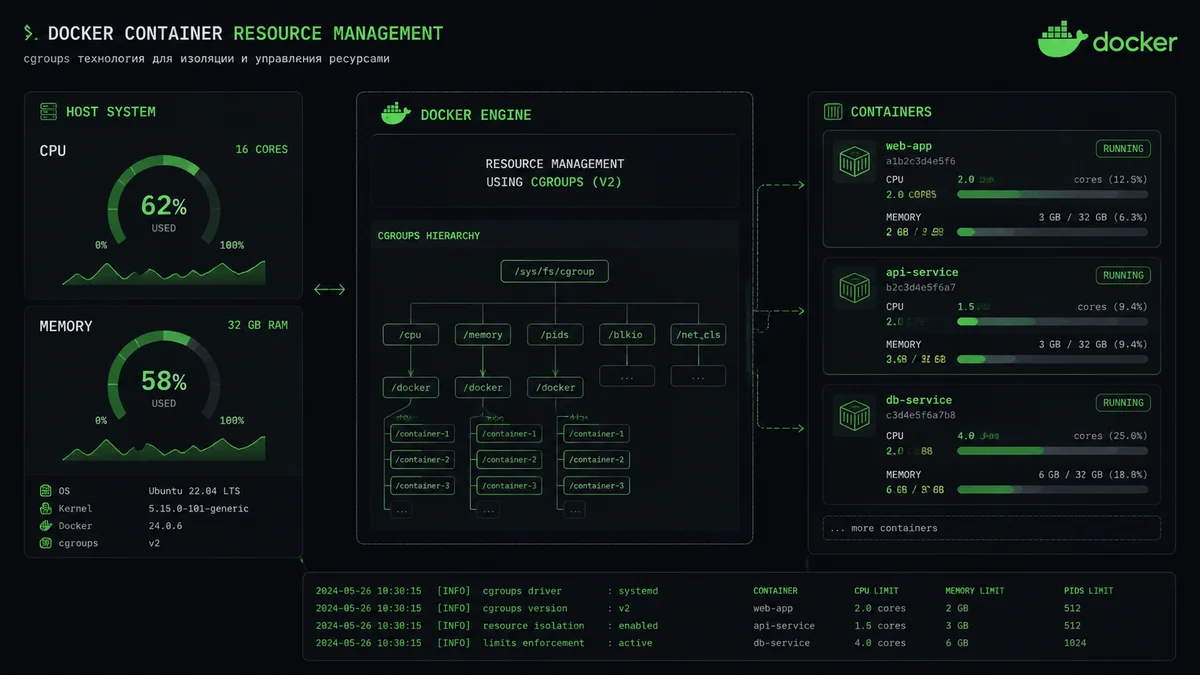
Docker containers share the host kernel and compete for finite resources — CPU cycles, memory, disk I/O, and process slots. Without proper limits, a single runaway container can starve all others and crash the host. In 2026, most production Linux distributions run cgroups v2 by default, which unifies resource accounting and enables features like unified hierarchy delegation and pressure stall information (PSI).
This guide walks through every major resource limit Docker supports on cgroups v2, shows real configuration patterns, and explains how to debug resource issues when containers misbehave.
Why Resource Limits Matter
Consider a typical multi-container server running a web app:
| Container | Without Limits | With Limits |
|---|---|---|
| Nginx (proxy) | Can be starved by backend | Guaranteed CPU slice |
| App (Node.js) | Memory leak kills host | OOM-killed, proxy stays up |
| PostgreSQL | Unlimited I/O degrades all | Predictable disk throughput |
| Worker queue | Spawns 1000 threads | PID limit prevents fork bomb |
Setting limits transforms a fragile system into a resilient one where individual failures are contained.
Prerequisites: Confirming cgroups v2
Before configuring limits, verify your system uses cgroups v2:
# Check if cgroups v2 is mounted
mount | grep cgroup2

# Check systemd support (required for cgroups v2)
stat -fc %T /sys/fs/cgroup/

# Should output: cgroup2fs
Most modern distributions ship with cgroups v2 enabled by default:
- Ubuntu 21.10+: cgroups v2 unified mode
- Debian 11+: cgroups v2 with systemd
- Fedora 31+: cgroups v2 default
- RHEL/AlmaLinux 9+: cgroups v2 only
If you see tmpfs instead of cgroup2fs, you’re still on cgroups v1. On those systems, enable cgroups v2 by adding systemd.unified_cgroup_hierarchy=1 to the kernel command line in GRUB, then reboot.
Memory Limits
Memory limits are the most critical resource control. Without them, a container with a memory leak will consume all available RAM and trigger the host’s OOM killer — which may not target the right process.
Setting Memory Limits
# Run container with 512 MB memory limit
docker run -d \
  --name my-app \
  --memory=512m \
  --memory-swap=512m \
  my-app:latest

# Verify the limit
docker stats --no-stream my-app
Key flags:
--memory=512m: Hard limit — the container cannot exceed this--memory-swap=512m: Set equal to--memoryto disable swap for this container. If you want swap, set it higher (e.g.,--memory=512m --memory-swap=1gallows 512 MB RAM + 512 MB swap)
Docker Compose Equivalent
services:
  my-app:
    image: my-app:latest
    deploy:
      resources:
        limits:
          memory: 512M
        reservations:
          memory: 256M
The reservations field tells Docker to guarantee this much memory. It’s useful for scheduling on Swarm or Kubernetes.
Understanding OOM Behavior
On cgroups v2, when a container hits its memory limit:
- The kernel first tries to reclaim page cache
- If that fails, the cgroup OOM killer activates
- The OOM killer selects the largest process within that cgroup
- Only the container’s processes are candidates — host processes are safe
# View OOM events for a container
dmesg | grep -i "oom" | grep docker

# Check cgroup memory pressure
cat /sys/fs/cgroup/docker/<container-id>/memory.events
Soft Limits vs Hard Limits
# Soft limit: kernel tries to keep usage below this, but allows burst
docker run -d \
  --memory-reservation=256m \
  --memory=512m \
my-app:latest- Soft limit (
--memory-reservation): During normal operation, the kernel will try to keep the container below this. Under memory pressure, the container will be squeezed down. - Hard limit (
--memory): Absolute ceiling — processes are OOM-killed if exceeded.
CPU Limits
CPU limits control how much processor time a container gets. Docker supports two approaches on cgroups v2:
CPU Quota (Absolute Limit)
# Limit container to 50% of one CPU core
docker run -d \
  --cpus=0.5 \
  --name limited-app \
  my-app:latest

# Limit to 2 full cores
docker run -d \
  --cpus=2.0 \
  my-app:latest
Under the hood, cgroups v2 translates --cpus=0.5 to:
cpu.max:50000 100000(50ms of CPU time per 100ms period)
CPU Shares (Relative Weight)
# Container A gets 2x the CPU of Container B
docker run -d --cpu-shares=2048 container-a:latest
docker run -d --cpu-shares=1024 container-b:latest
Shares are relative, not absolute. If only container B is running, it can use all available CPU. Shares only matter when containers compete.
Docker Compose CPU Configuration
services:
  web-app:
    image: web-app:latest
    deploy:
      resources:
      limits:
          cpus: '1.5'
        reservations:
          cpus: '0.5'

  background-worker:
    image: worker:latest
    deploy:
      resources:
        limits:
          cpus: '0.25'
CPU Affinity (Advanced)
You can pin containers to specific CPU cores:
# Run on CPU cores 0 and 1 only
docker run -d \
  --cpuset-cpus=0,1 \
  my-app:latest

# Run on cores 2-3
docker run -d \
  --cpuset-cpus=2-3 \
  another-app:latest
This is valuable for latency-sensitive workloads that suffer from cache invalidation during core migration.
Disk I/O Limits
Disk I/O contention is often the hardest to diagnose but easiest to prevent with limits.
I/O Bandwidth Limiting
# Limit write speed to 50 MB/s on /dev/sda
docker run -d \
  --device-write-bps /dev/sda:50mb \
  --device-read-bps /dev/sda:100mb \
  my-app:latest
Available I/O rate limiters:
--device-read-bps: Maximum read bytes per second--device-write-bps: Maximum write bytes per second--device-read-iops: Maximum read operations per second--device-write-iops: Maximum write operations per second
Docker Compose I/O Limits
services:
  database:
    image: postgres:16
    volumes:
      - pgdata:/var/lib/postgresql/data
    deploy:
      resources:
        limits:
          # Note: Docker Compose doesn't support device-level I/O limits directly
          # Use runtime flags or init scripts for fine-grained control
    device_write_bps:
      - path: /dev/sda
        rate: '50mb'
    device_read_iops:
      - path: /dev/sda
        rate: '1000'
Verifying I/O Limits
# Check cgroup v2 I/O stats
cat /sys/fs/cgroup/system.slice/docker-<container-id>.scope/io.stat

# Monitor real-time I/O
iostat -x 1 | grep sda
PID Limits
A fork bomb or run-away process spawning can exhaust the system’s PID space, preventing new processes from starting — including SSH.
# Limit container to 100 processes
docker run -d \
  --pids-limit=100 \
  my-app:latest

# Default Docker daemon PID limit (check your config)
docker info | grep -i "pids limit"
You can also set a system-wide default in /etc/docker/daemon.json:
{
  "default-pids-limit": 500
}
Docker Compose PID Limit
services:
  my-app:
    image: my-app:latest
    pids_limit: 200
Complete Production Example
Here’s a realistic multi-service setup with comprehensive resource limits:
services:
  nginx:
    image: nginx:1.27-alpine
    ports:
      - "80:80"
      - "443:443"
    deploy:
      resources:
        limits:
          memory: 256M
          cpus: '0.5'
        reservations:
          memory: 128M
          cpus: '0.25'
    pids_limit: 50
    restart: unless-stopped

  app:
    image: myapp:2.1
    environment:
      - NODE_ENV=production
    deploy:
      resources:
        limits:
          memory: 512M
          cpus: '1.0'
        reservations:
          memory: 256M
          cpus: '0.5'
    pids_limit: 150
    depends_on:
      - postgres
      - redis
    restart: unless-stopped

  postgres:
    image: postgres:16-alpine
    volumes:
      - pgdata:/var/lib/postgresql/data
    deploy:
      resources:
        limits:
          memory: 1G
          cpus: '2.0'
        reservations:
          memory: 512M
          cpus: '1.0'
    pids_limit: 100
    restart: unless-stopped

  redis:
    image: redis:7-alpine
    volumes:
      - redisdata:/data
    deploy:
      resources:
        limits:
          memory: 256M
          cpus: '0.5'
        reservations:
          memory: 128M
          cpus: '0.25'
    pids_limit: 50
    restart: unless-stopped

  worker:
    image: myapp-worker:2.1
    deploy:
      resources:
        limits:
          memory: 768M
          cpus: '1.5'
        reservations:
          memory: 384M
          cpus: '0.75'
    pids_limit: 200
    depends_on:
      - redis
    restart: unless-stopped

volumes:
  pgdata:
  redisdata:
This configuration ensures:
- Nginx always stays responsive (low limits, but guaranteed)
- The app server can handle bursts but won’t crash the host
- PostgreSQL gets the most resources (database workloads are resource-heavy)
- Redis stays lean and fast
- Background workers can use significant resources without starving other services
Monitoring and Debugging
Real-Time Resource Usage
# Watch all container resource usage
docker stats

# One-time snapshot
docker stats --no-stream

# Filter by name
docker stats --no-stream nginx postgres app
Detailed cgroups v2 Stats
# Find the container's cgroup path
CONTAINER_ID=$(docker inspect --format='{{.Id}}' my-app)

# Memory details
cat /sys/fs/cgroup/system.slice/docker-${CONTAINER_ID}.scope/memory.current
cat /sys/fs/cgroup/system.slice/docker-${CONTAINER_ID}.scope/memory.max
cat /sys/fs/cgroup/system.slice/docker-${CONTAINER_ID}.scope/memory.events

# CPU details
cat /sys/fs/cgroup/system.slice/docker-${CONTAINER_ID}.scope/cpu.stat

# Pressure Stall Information (PSI)
cat /sys/fs/cgroup/system.slice/docker-${CONTAINER_ID}.scope/memory.pressure
cat /sys/fs/cgroup/system.slice/docker-${CONTAINER_ID}.scope/cpu.pressure
Understanding PSI Output
PSI tells you how much time processes spend stalled waiting for resources:
cat /sys/fs/cgroup/system.slice/docker-${CONTAINER_ID}.scope/memory.pressure
# Output format:
# some avg10=0.00 avg60=0.01 avg300=0.05 total=123456
# full avg10=0.00 avg60=0.00 avg300=0.02 total=45678- some: Percentage of time some tasks are stalled
- full: Percentage of time all tasks are stalled (CPU is fully utilized)
- avg10/avg60/avg300: Averages over 10s, 60s, and 300s windows
- total: Total stall time in microseconds
High PSI values indicate genuine resource bottlenecks, not just high utilization.
Common Patterns by Workload Type
| Workload | Memory | CPU | PID | I/O |
|---|---|---|---|---|
| Web proxy (Nginx) | 128-256M | 0.25-0.5 | 50 | Read-heavy |
| Node.js app | 256-1024M | 0.5-2.0 | 100-200 | Moderate |
| PostgreSQL | 512M-4G | 1.0-4.0 | 100-500 | Write-heavy |
| Redis | 128-512M | 0.25-0.5 | 50 | RAM-based |
| Build worker | 1-4G | 2.0-8.0 | 500+ | Burst I/O |
| Log collector | 128-256M | 0.25-0.5 | 50 | Sequential write |
Best Practices
- Always set memory limits: Memory leaks are common. A hard limit protects the host.
- Disable swap for containers: Set
--memory-swapequal to--memoryto prevent containers from being slowed by swap. - Use CPU shares over quotas for most workloads: Shares allow containers to burst when resources are available. Use quotas only when you need strict isolation.
- Set PID limits: Prevents fork bombs and runaway process spawning.
- Monitor with PSI, not just usage: High usage doesn’t always mean a bottleneck — PSI tells you if tasks are actually waiting.
- Test limits in staging: A limit that’s too tight causes OOM kills or throttled performance. Start generous and tighten based on monitoring data.
- Document your limits: Include resource limits in your Docker Compose files and keep a spreadsheet of allocation vs. usage.
- Set daemon defaults: Configure reasonable defaults in
/etc/docker/daemon.jsonso every container gets at least basic protection.
Conclusion
Proper resource limits are not optional for production Docker deployments. They prevent a single misbehaving container from taking down your entire server, enable predictable performance, and make capacity planning possible.
With cgroups v2 providing unified resource accounting and PSI giving deeper insight into actual contention, the tooling has never been better. Start with memory limits (they’re the most impactful), add CPU controls next, and layer on I/O and PID limits as you grow your monitoring maturity.
The investment of a few hours setting up these limits will save you from 3 AM fire calls when a container decides to consume all available memory.