Most Linux performance problems announce themselves. The server stops responding. The OOM killer starts terminating processes. The disk fills up and everything grinds to a halt. Those are the easy ones — you know something is broken, and the symptoms point you toward the cause.
The harder problems are the ones where nothing looks broken. CPU usage is at 40%, memory is fine, disk I/O looks normal, and yet the application feels sluggish. Pages take an extra second to load. API responses creep from 50ms to 200ms. Nobody files an incident because nothing is technically down, but everyone notices the degradation. These are the problems that erode user trust slowly, over weeks, until someone finally asks “why is the server so slow?” and nobody has a clear answer.
This guide is for those problems. It assumes you have basic familiarity with Linux and the standard monitoring tools — top, free, df — and takes you into the systematic diagnostic workflow that finds the bottleneck when the obvious metrics are lying to you.
Step 1: Define “Slow” In Measurable Terms
Before you touch a single command, define what “slow” actually means. “The server feels sluggish” is not a diagnosis. “API endpoint /users/search takes 280ms at P95 when it should take 80ms” is a diagnosis.
If you have application-level metrics — response times, error rates, throughput — start there. Correlate them with system-level metrics to narrow the time window. A latency spike that starts at 14:32 UTC and ends at 14:47 UTC is a much smaller haystack than “it’s been slow all week.”
If you don’t have application-level metrics, write a quick benchmark. A curl loop hitting the slow endpoint once per second, logging response times, will give you a baseline in five minutes. The goal is to turn a vague complaint into a specific measurement that you can reproduce and track.
Step 2: Check What the Kernel Is Actually Doing
The standard monitoring tools — top, htop, vmstat — are coarse instruments. They show you what’s happening at the process level, aggregated over one-second or five-second intervals. That’s enough to catch a runaway process eating 100% CPU. It’s not enough to catch a brief I/O stall, a scheduler latency spike, or a network buffer bloat that lasts half a second but happens fifty times a minute.
Start with dstat or sar for historical context. If you have sysstat installed, sar -A will show you CPU, memory, I/O, and network metrics going back days. Look for correlations: did the performance degradation start at the same time as a spike in network retransmissions? Did disk I/O wait times increase after a cron job ran at midnight?
If sysstat is not installed, install it now. It is the single highest-leverage performance diagnostic you can add to a server, because it answers the question “what changed?” when you were not watching.
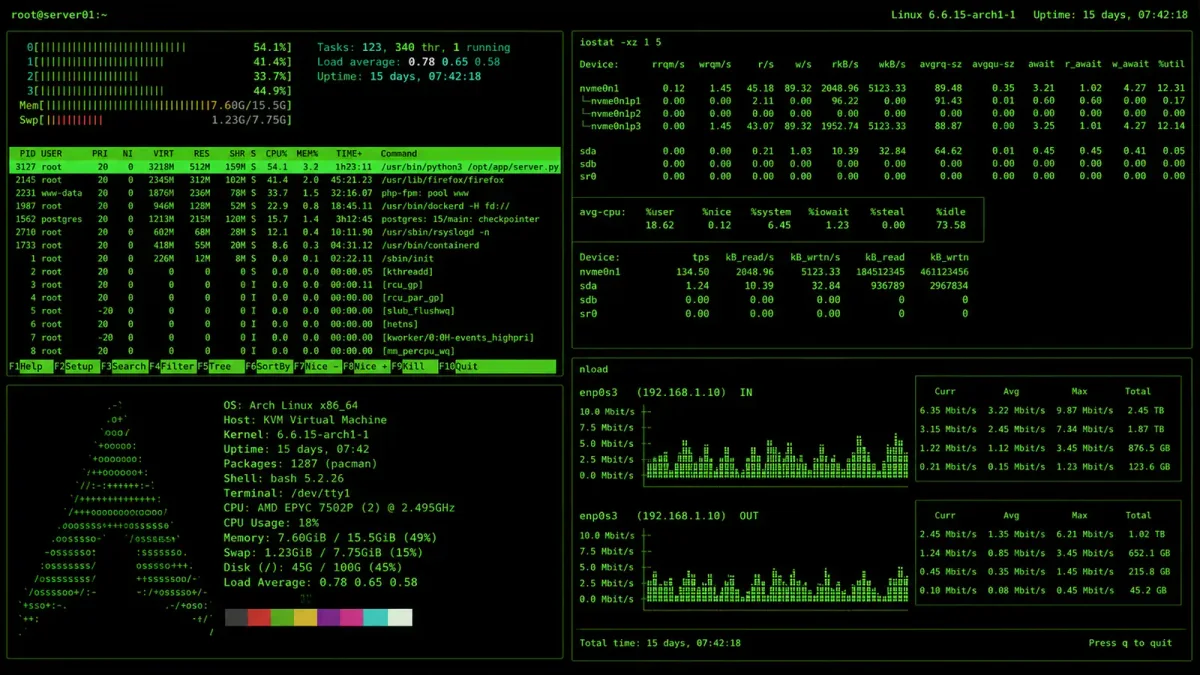
For live diagnosis, run these commands in parallel across multiple terminal windows or tmux panes:
htop— process-level overview, sorted by CPU or memoryiostat -x 2— disk utilization, await times, queue depth. Ifawaitis above 10ms on SSD or 30ms on HDD, you have a disk bottlenecksar -n DEV 2— network throughput and errors per interfacedstat -t -c -d -n -m --top-io --top-cpu 2— a consolidated dashboard that shows everything at once
The key is watching them simultaneously. A CPU spike that correlates with a disk I/O spike suggests the application is doing something filesystem-intensive. A latency spike that correlates with network retransmits suggests a networking issue. Isolated metrics are misleading; correlated metrics tell a story.
Step 3: CPU — It’s Not Just About Percentage
CPU utilization percentages are the most misleading metric in system monitoring. A server at 40% CPU can be completely saturated if the workload is single-threaded and pinned to one core. A server at 90% CPU can be perfectly responsive if the work is evenly distributed and the scheduler is doing its job.
Check per-core utilization with mpstat -P ALL 2. If one core is at 100% and the others are idle, you have a single-threaded bottleneck — common in Node.js applications, Python scripts, and database workloads that use a single connection. The fix is usually application-level: connection pooling, worker processes, or async I/O.
Check CPU steal time with top or mpstat. The %st column shows how much time the hypervisor is taking from your virtual CPU to give to another VM. If steal time is above 5% consistently, your cloud provider is oversubscribing the host and you need to either migrate to a different instance or complain to support. Steal time above 10% means your VM is essentially sharing a CPU with someone else’s noisy neighbor, and no amount of tuning inside the VM will fix it.
Check context switch rate with vmstat 2. If the cs column is above 50,000 per second, the system is spending significant time just switching between processes. This often indicates too many threads contending for CPU, or an application that spawns and destroys threads rapidly instead of using a thread pool.
Step 4: Memory — Free Memory Is a Lie
The free command shows you a number labeled “free” and a number labeled “available.” The “free” number is essentially useless — Linux uses unused memory for disk caching, and that memory is released instantly when an application needs it. The “available” number is what matters: it estimates how much memory a new process could allocate without triggering swapping.
If “available” is low but swap usage is zero, your system is fine — it is using memory efficiently. If swap usage is non-zero and vmstat 2 shows non-zero si (swap in) and so (swap out) columns, your system is actively swapping and performance will degrade rapidly. Active swapping is the kiss of death for server performance — the latency of swapping to disk is thousands of times higher than RAM access, and the entire system slows to a crawl.
Check for memory leaks with a simple watch loop: watch -n 5 'ps aux --sort=-%mem | head -20'. If a process’s RSS (Resident Set Size) is growing monotonically without bound, you have a memory leak. Track it over hours, not minutes — a gradual leak of 50MB per hour will take your server down in two days, but it’s invisible in a five-minute monitoring window.
The /proc/meminfo file has more detail than free. cat /proc/meminfo | grep -E 'Dirty|Writeback|Slab' shows you kernel memory usage. A large “Dirty” value means there is a lot of unwritten data in the page cache — typically from a process writing heavily to disk — which can cause I/O stalls when the kernel flushes it.
Step 5: Disk I/O — Queue Depth Tells the Real Story
Disk utilization percentage is bad. Disk queue depth — the avgqu-sz column in iostat -x — is what actually matters. Utilization tells you whether the disk is busy. Queue depth tells you whether requests are piling up waiting for the disk, which is what users actually experience as slowness.
A queue depth consistently above 1.0 means requests are waiting. Above 3.0 means the disk is a serious bottleneck. The fix depends on the workload: for random reads, add more RAM for caching. For random writes, batch them or move to an SSD with better random write performance. For sequential reads, check whether you’re reading unnecessarily — are you scanning entire tables when an index would suffice?
Use iotop to identify which process is generating the I/O. Sort by actual disk read/write, not just I/O requests — a process doing small random reads can show high I/O usage in iotop while transferring very little data.
Check filesystem-specific metrics with df -i. If inode usage is at 100% but disk space is fine, you have too many small files and new files cannot be created. This is common on mail servers, log directories, and cache directories. The fix is deleting files or tuning the filesystem to use fewer inodes per block.
Step 6: Network — Latency, Not Bandwidth
Most network performance problems are latency problems, not bandwidth problems. A 1Gbps link that adds 50ms of latency per packet feels slower than a 100Mbps link with 1ms of latency, because TCP throughput is bounded by the bandwidth-delay product and most application protocols are chatty.
Start with ping for baseline latency to the gateway and to external hosts. Look for packet loss and jitter (variance in latency). Consistent 1ms latency with occasional 500ms spikes is worse than consistent 10ms latency — applications can adapt to steady latency, but variance causes timeouts and retries.
Use ss -s to check socket statistics: how many connections are in ESTABLISHED, TIME_WAIT, and CLOSE_WAIT states. Thousands of sockets in TIME_WAIT mean your application is opening and closing connections rapidly instead of reusing them. Sockets stuck in CLOSE_WAIT mean the application is not properly closing connections — a common bug in custom network code.
Use sar -n EDEV 2 to check for network errors at the hardware level: dropped packets, CRC errors, carrier errors. These indicate physical layer problems — bad cables, failing NICs, switch port issues — that will never show up in application-level monitoring but will cause intermittent performance problems that drive you insane.
Finally, use tcptrack or iftop to see which connections are consuming bandwidth in real time. A single misbehaving client downloading a large file can saturate a connection that is otherwise fine.
Putting It All Together
The systematic approach is not about using every tool at once. It is about eliminating possibilities in order, from most likely to least likely, until the bottleneck reveals itself.
Start at the application layer: what is slow, and how slow is it? Move to the system layer: correlate application slowdowns with system metrics. Drill into the specific subsystem — CPU, memory, disk, network — that the correlation points to. Confirm with a targeted test: if you suspect disk I/O, run dd if=/dev/zero of=/tmp/test bs=1M count=1000 oflag=direct and watch the await times in iostat. If you suspect network latency, run mtr to the destination and look for the hop where latency spikes.
The hardest performance problems are the ones where two things are wrong at once — a slow disk and a memory leak, or network packet loss and CPU contention from a cron job. The correlation approach catches these: if fixing one bottleneck doesn’t restore performance, there is a second bottleneck hiding behind it. Fix the most obvious one, re-measure, and repeat.
Most importantly: write down what you found. The next time the server feels slow, you will have a baseline of what “normal” looks like for every metric, and the anomaly will jump off the screen instead of blending into the noise.