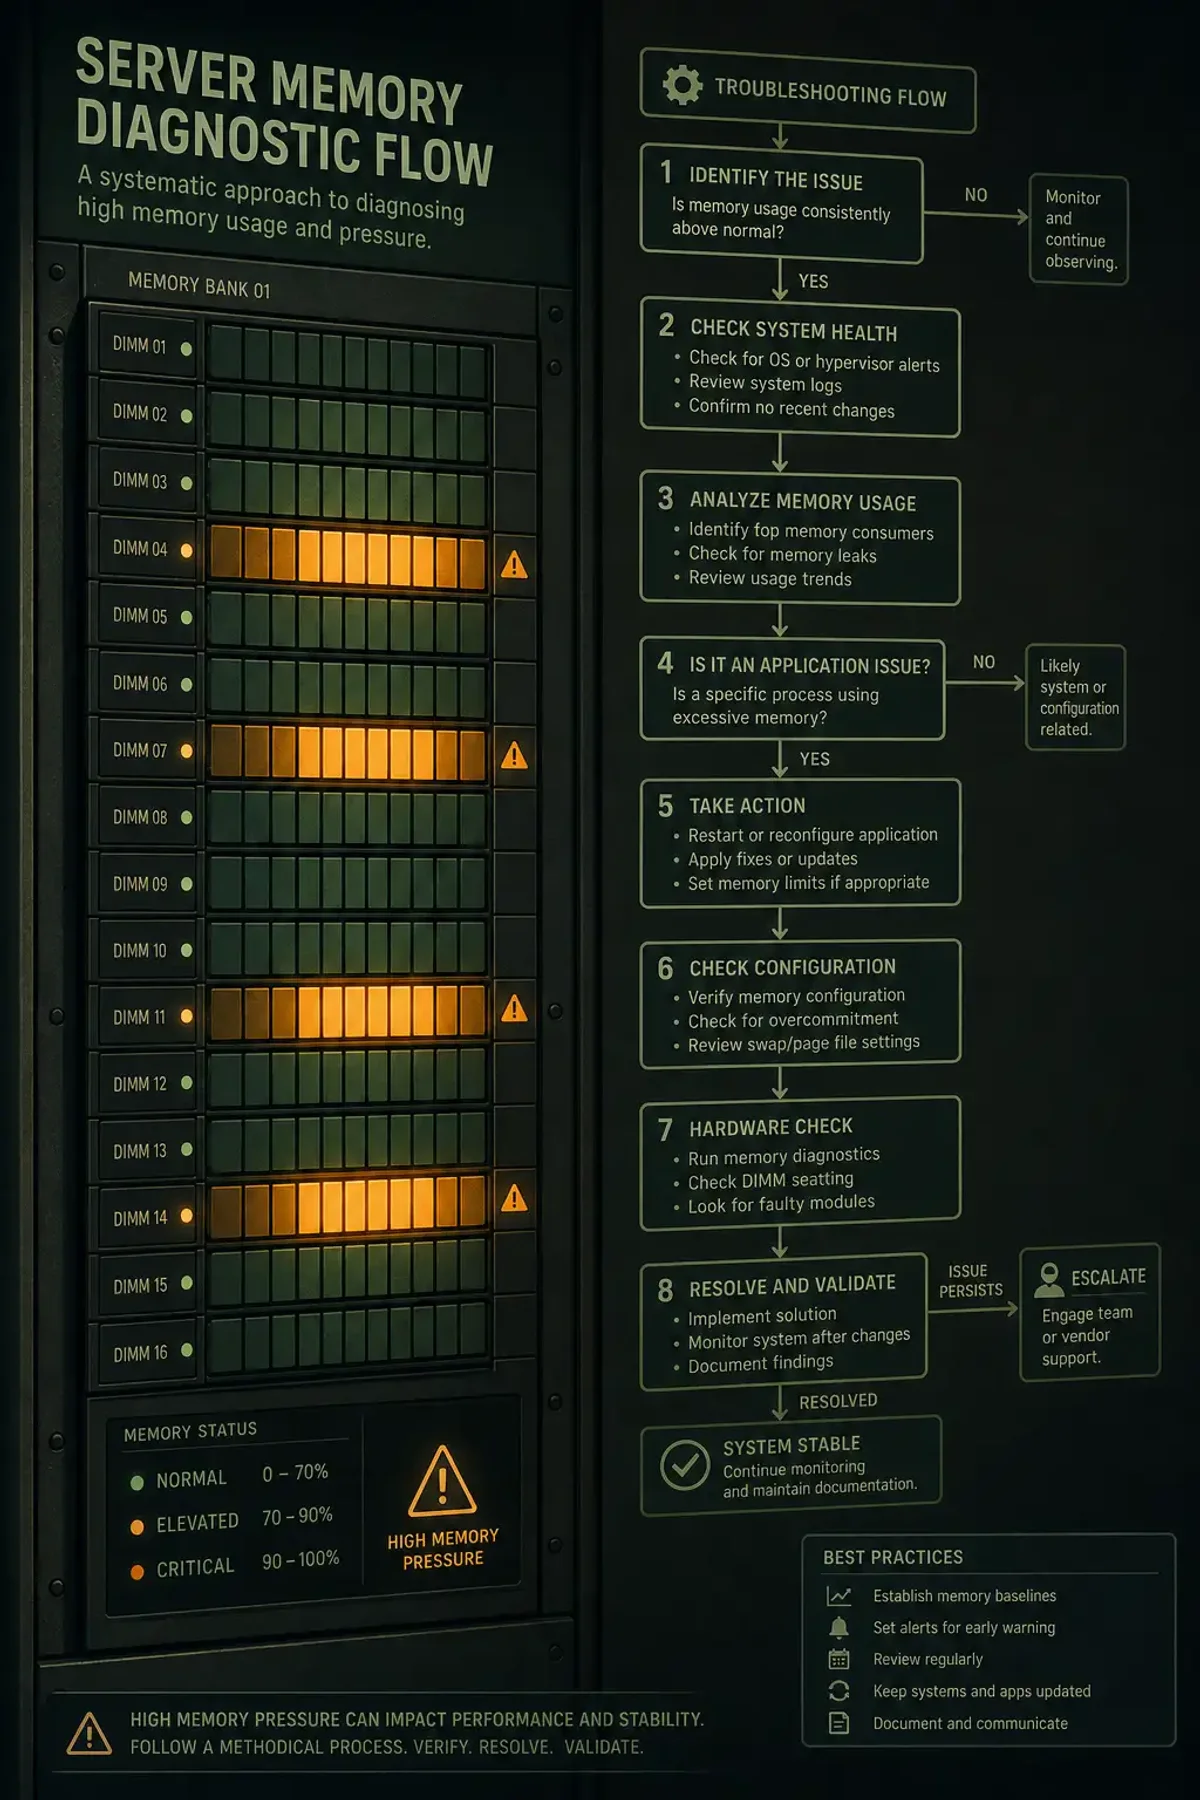
The Methodical OOM Workflow
When a production process is killed by the OOM killer, don’t just restart. Find the root cause.
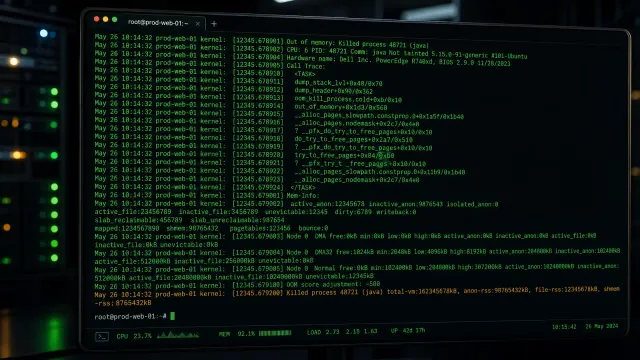
Step 1: Confirm OOM
dmesg -T | grep -i "out of memory"
dmesg -T | grep -i "killed process"
Step 2: Historical Memory State
journalctl -u postgresql.service --since "1 hour ago" | tail -50
sar -r | tail -20
If you have Prometheus: node_memory_MemAvailable_bytes.
Step 3: Current Memory
free -h
cat /proc/meminfo
ps aux --sort=-%mem | head -20
Key metrics: MemAvailable, CommitLimit vs Committed_AS, Cached.
Step 4: Check for Leaks
while true; do
    ps -o pid,rss,comm -p $(pgrep suspicious) >> /tmp/memlog.txt
    sleep 10
done
Check /proc/PID/smaps for detailed memory maps. Pss (Proportional Set Size) is the most accurate metric.
Step 5: Process Spikes
ps aux | wc -l
ps aux | awk '{print $1}' | sort | uniq -c | sort -rn | head -10
Step 6: Page Cache Analysis
grep -E "^(Dirty|Writeback):" /proc/meminfoHigh Dirty pages with slow disk = kernel cannot reclaim cache fast enough.
Step 7: Overcommit Settings
cat /proc/sys/vm/overcommit_memory
# 0: heuristic (default), 1: always, 2: never
For databases: vm.overcommit_memory=2 with vm.overcommit_ratio=80.
Step 8: Prevention
Systemd memory limits:
[Service]
MemoryMax=2G
MemoryHigh=1.5G
OOM score protection for critical services:
echo -1000 > /proc/$(pgrep sshd)/oom_score_adjAdd swap buffer:
sudo fallocate -l 2G /swapfile
sudo chmod 600 /swapfile && sudo mkswap /swapfile && sudo swapon /swapfile
Prometheus alert:
(node_memory_MemTotal_bytes - node_memory_MemAvailable_bytes)
/ node_memory_MemTotal_bytes > 0.9
The best OOM event is the one you see coming 30 minutes before it happens.