The perf Toolkit
perf is the Linux kernel’s built-in profiler. It samples CPU events at high frequency and builds statistical profiles showing exactly where time is spent — down to the instruction level. When top shows high CPU but you can’t tell why, perf tells you which function, which line, even which CPU instruction is the bottleneck.
Installation:
sudo apt install linux-tools-common linux-tools-$(uname -r) -yQuick Diagnosis with perf top
perf top is like top for CPU sampling — live, function-level view:
sudo perf topOutput shows functions sorted by CPU time with a live histogram. Look for the top entries immediately. If you see [kernel] functions dominating, it’s a kernel-side bottleneck. User-space functions mean the application itself is the problem.
Key columns:
Overhead: Percentage of CPU samples in this functionShared Object: Which binary/library contains the functionSymbol: The function name
Recording a Profile
For offline analysis, record samples:
# Record CPU cycles for 30 seconds, system-wide
sudo perf record -a -g -F 99 -- sleep 30

# Record for a specific PID
sudo perf record -p 12345 -g -F 99 -- sleep 30

# Record for a specific command
sudo perf record -g -F 99 -- your-command --with-args
Flags:
-a: System-wide (all CPUs)-g: Capture call graphs (stack traces)-F 99: Sample at 99 Hz (avoid lockstep with timer interrupts at 100 Hz)
Interpreting the Report
sudo perf reportThe interactive TUI shows:
Children: Total overhead including functions called by this functionSelf: Overhead of the function’s own instructions (not its callees)
If Children is high but Self is low, the function is slow because of what it calls. If Self is high, the function’s own code is the bottleneck.
For script-friendly output:
sudo perf report --stdio --sort=comm,dso,symbol | head -20Flame Graphs
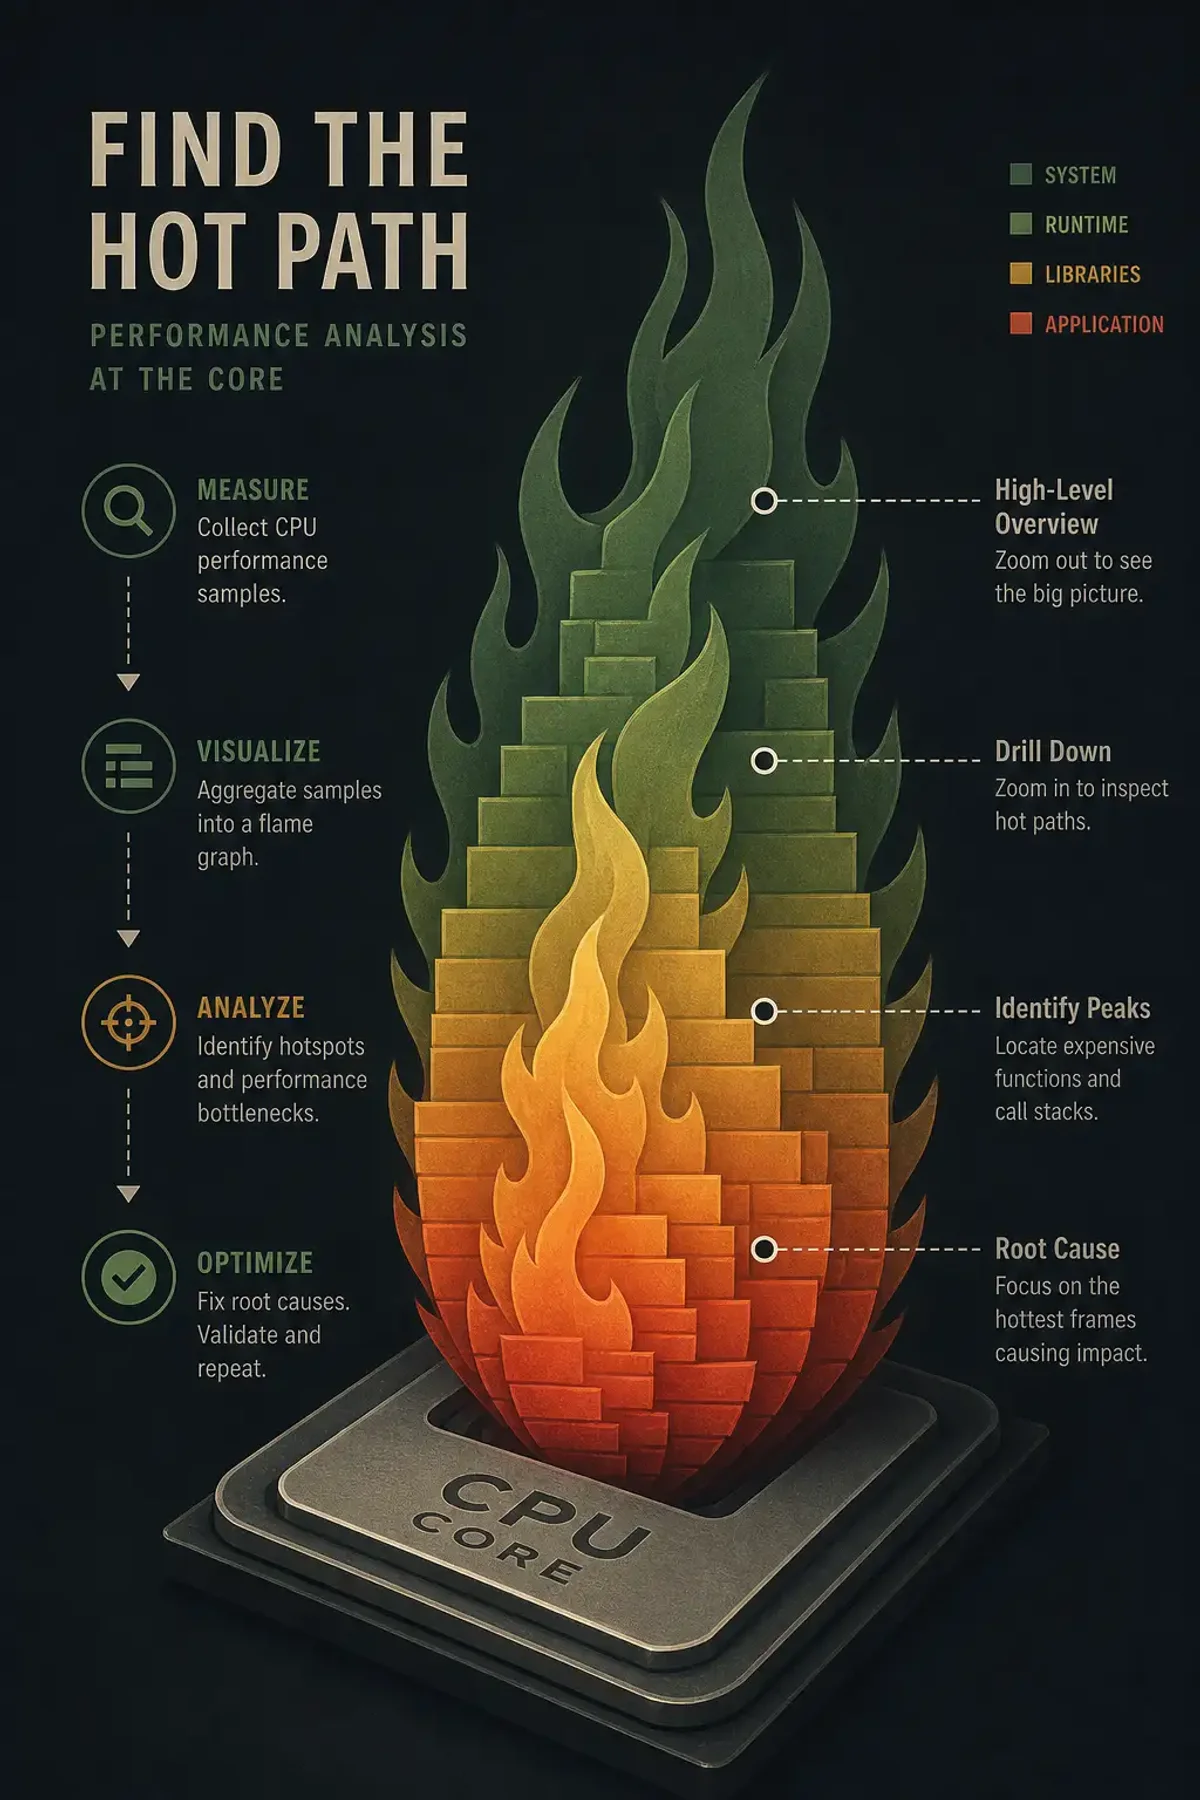
Flame graphs visualize call stacks. Install Brendan Gregg’s tools:
git clone https://github.com/brendangregg/FlameGraph.gitGenerate:
sudo perf script > out.perf
./FlameGraph/stackcollapse-perf.pl out.perf > out.folded
./FlameGraph/flamegraph.pl out.folded > flamegraph.svg
Open flamegraph.svg in a browser. The x-axis is proportional to CPU time. The y-axis is the call stack (bottom = caller, top = callee). Wide bars at the top = hot functions.
Common Patterns
High CPU in __x64_sys_futex: Thread synchronization bottleneck. Too many threads contending on locks. Consider reducing thread count or switching to a lock-free data structure.
High CPU in copy_user_enhanced_fast_string: Excessive data copying between kernel and user space. Look for large read()/write() calls or mmap inefficiencies.
High CPU in _raw_spin_lock: Spin lock contention. Spin locks are supposed to be held for microseconds, not milliseconds. A function holding a spin lock too long is the root cause.
High CPU in native_queued_spin_lock_slowpath: Same as above — locked section is too long, or there’s lock contention from too many threads.
High CPU in __do_softirq: High interrupt load. Check /proc/interrupts for which IRQ is firing:
watch -n 1 'cat /proc/interrupts | head -20'Profiling Specific Events
Beyond CPU cycles, perf can sample on other events:
# Cache misses (often the real bottleneck)
sudo perf record -e cache-misses -a -g -- sleep 30

# Context switches
sudo perf record -e context-switches -a -g -- sleep 30

# Page faults
sudo perf record -e page-faults -a -g -- sleep 30

# Branch mispredictions
sudo perf record -e branch-misses -a -g -- sleep 30

# List available events
sudo perf list
On-CPU vs Off-CPU Analysis
perf record profiles on-CPU time — what’s using the CPU. For off-CPU time (blocked on I/O, locks, sleep), use perf trace or bcc tools:
# Using bcc offcputime
sudo /usr/share/bcc/tools/offcputime -p 12345 30
Often the problem isn’t what’s on-CPU but what’s waiting. A database query that spends most time waiting for disk I/O will look idle in perf top but is the real bottleneck.
Attaching to Running Processes
No need to restart:
# PID 12345, sample for 30 seconds
sudo perf record -p 12345 -g -- sleep 30

# Attach to process by name
sudo perf record -p $(pgrep nginx | head -1) -g -- sleep 30
Attaching from outside a container:
PID=$(docker inspect -f '{{.State.Pid}}' my-container)
sudo perf record -p $PID -g -- sleep 30
Practical Workflow
toporhtopconfirms high CPU usagesudo perf topidentifies the hot functionsudo perf record -p PID -g -F 99 -- sleep 30captures a profilesudo perf reportor flame graph visualizes the bottleneck- If the hot function isn’t obvious, switch to event sampling (
cache-misses,branch-misses) - Fix the code, redeploy, verify CPU drops
Summary
perf is the first tool to reach for when CPU is high and you don’t know why. perf top for live diagnosis, perf record + perf report for detailed analysis, flame graphs for visualization. The key skill is pattern recognition — learning what __x64_sys_futex, copy_user_enhanced_fast_string, and _raw_spin_lock tell you about your application’s behavior.